Figures & data
Table 1. Pathological parameters in the sham, 5/6 nx and lotensin groups.
Figure 1. Protective effect of lotensin on renal morphology. (A) Hematoxylin-eosin staining of renal tissues (×200); (B) tubulointerstitial injury grades; *p < .05 vs. the sham group; #p < .05 vs. the 5/6 Nx group (n = 10).
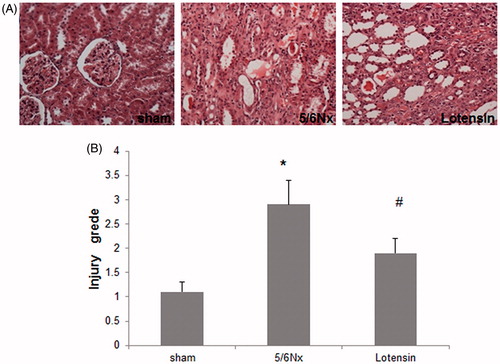
Figure 2. Effect of lotensin on TGF-β1 expression in renal epithelium. (A) Immunohistochemical staining of TGF-β1 (×200); (B) Quantification of the staining of TGF-β1; *p < .05 vs. the sham group; #p < .05 vs. the 5/6 Nx group (n = 10).
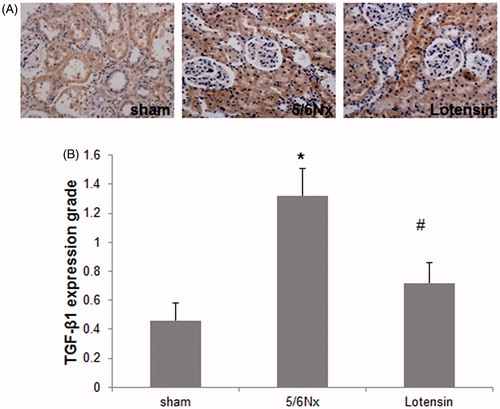
Figure 3. Effect of lotensin on TGF-β1 expression in renal tissues. (A) Western blot analysis of TGF-β1 expression in renal tissues; (B) Quantification of TGF-β1 protein expression by normalization to β-actin; *p < .05 vs. the sham group; #p < .05 vs. the 5/6 Nx group (n = 10).
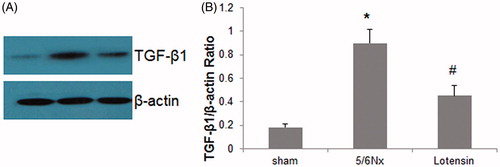
Figure 4. Effect of lotensin on α-SMA expression in renal interstitium. (A) Immunohistochemical staining of α-SMA (×200); (B) Quantification of the staining of α-SMA; *p < .05 vs. the sham group; #p < .05 vs. the 5/6 Nx group (n = 10).
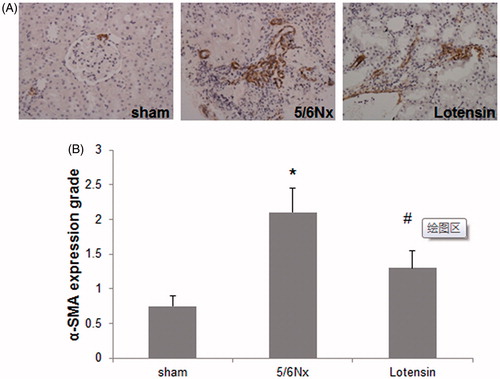
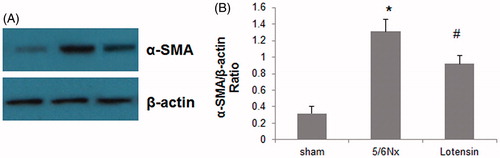
Figure 5. Effect of lotensin on α-SMA expression in renal tissues. (A) Western blot analysis of α-SMA expression in renal tissues; (B) Quantification of α-SMA protein expression by normalization to β-actin; *p < .05 vs. the sham group; #p < 0.05 vs. the 5/6 Nx group (n = 10).