
Figures & data
Figure 1. Flow Chart of study selection.
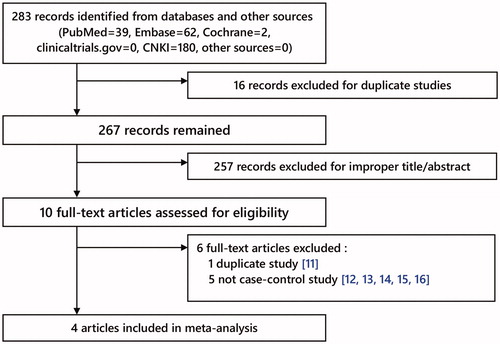
Table 1. Characteristics of studies included in the meta-analysis.
Table 2. Characteristics of cases and controls.
Table 3. Summary of pooled ORs in the meta-analysis.
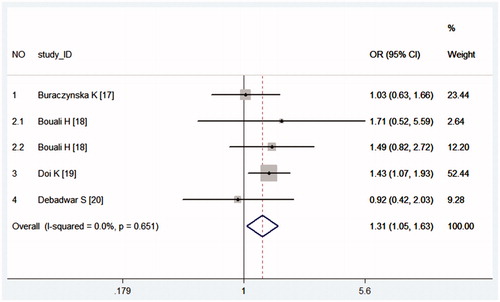
Figure 2. Forest plot with a fixed effects model for the association between chronic kidney disease and MPO -463G > A in allelic comparison (G vs. T). For each study, the estimate of OR and its 95% CI is plotted with a box and a horizontal line. Rhombus: pooled OR and its 95% CI.
Supplemental material