Figures & data
Figure. 1. The ratio of mucosal infections for IgAN patients in two groups. No mucosal infection in the Xi’an group was lower than that in the Guangzhou group. Upper respiratory infection and biliary tract infection in the Xi’an group was higher than that in the Guangzhou group. *p < .05 versus control.
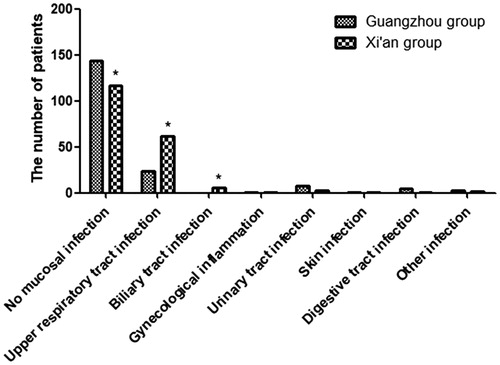
Figure. 2. The clinical presentations of patients with IgAN in two groups. Abnormal urinalysis in the Xi’an group was lower than that in the Guangzhou group. Debilitation and lumbago in the Xi’an group was higher than that in the Guangzhou group. *p < .05 versus control.
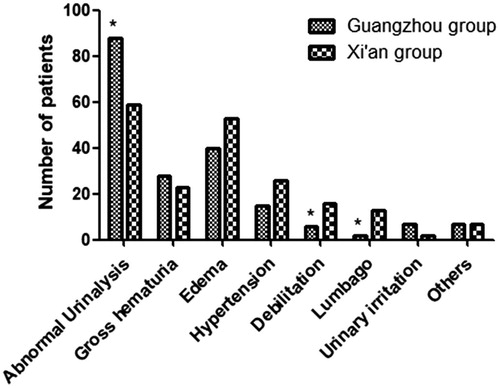
Table 1. The comparison of clinical characteristics between the two groups.
Figure. 3. The ratio of immune fluorescence components in two groups. The percentage of immune complex depositions in the mesangial area and capillary wall is shown. The number of the patients with the immune complex deposition was also shown.
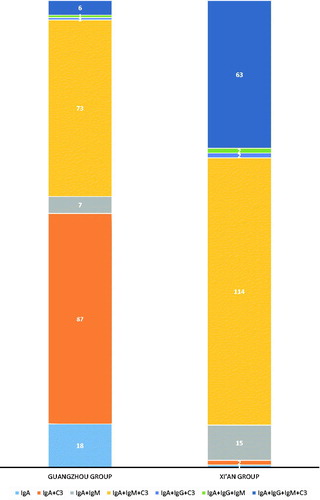
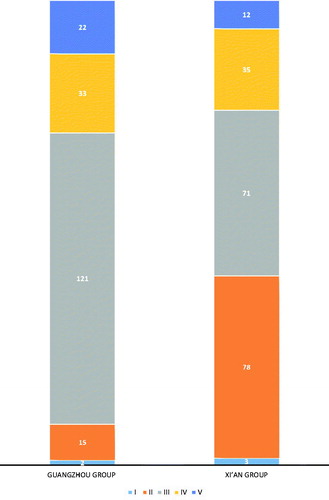
Figure. 4. The renal lesions distributed in 392 patients in two groups by Lee Grade. All biopsies from 392 patients were graded by Lee’s classification. Distribution into the five different histological grades at the time of renal biopsy is shown. The symbol.