Figures & data
Table 1. A time course evaluation of morphological changes in the passive NTN model.
Figure 1. A time course evaluation of clinical measurements of the passive NTN model. (A) XY plot showing body weight (BW) over time. (B) XY plot showing the urinary albumin excretion rate (UAER). Data are shown as mean ± SD. ***p < .001, ****p < .0001, NTN group vs. healthy control group by one-way ANOVA.
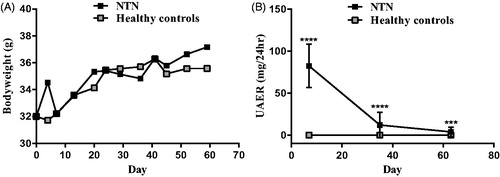
Figure 2. A time course evaluation of morphological changes in the passive NTN model. (A) Scatter plot is showing semi-quantification of Perl positive area in the cortex area. (B) Scatter plot is showing semi-quantification of Collagen III positive area in the cortex area. (C) Scatter plot is showing semi-quantification of the Ki-67 positive area in the cortex area. (D) Representative images are showing the Ki-67 positive area in the cortex area. Data are shown as mean ± SD. **p < .01, ****p < .0001 NTN groups vs. healthy control groups and, #p < .05, ##p < .01, ###p < .001 ####p < .0001 NTN group vs. NTN group by one-way ANOVA using Tukey’s multiple comparisons test (n = 10).
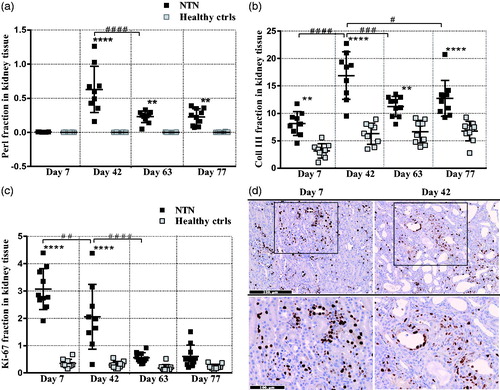
Figure 3. Time course of renal inflammatory response. (A) Scatter plot is showing semi-quantification of the CD45 positive area of the cortex area. (B) Scatter plot is showing semi-quantification of the CD3 positive area of the cortex area. (C) Scatter plot is showing semi-quantification of F4/80 positive area of the cortex area. (D) Scatter plot is showing semi-quantification of the C3d positive area of the cortex area. (E) Representative histopathological images of the disease change over time. Data are shown as mean ± SD. **p < .01, ***p < .001, ****p < .0001 NTN groups vs. healthy control groups and, ##p < .01, ###p < .001 ####p < .0001 NTN group vs. NTN group by one-way ANOVA using Tukey’s multiple comparisons test (n = 10).
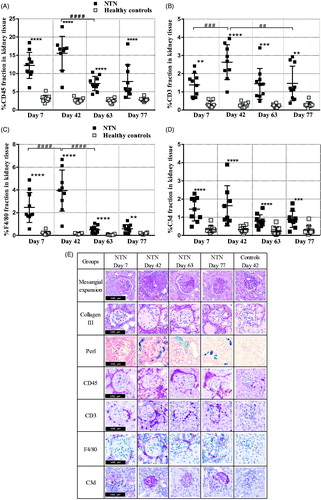
Figure 4. Inhibitors of the renin-angiotensin system improves the kidney function. Scatter plot showing the glomerular filtration rate (GFR) measured on day 38–40. Data are shown as mean ± SD. *p < .05, ****p < .0001 groups vs. vehicle group by one-way ANOVA.
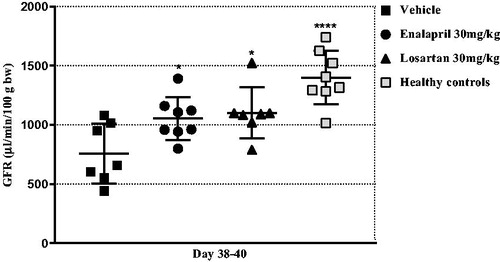
Table 2 The effect of inhibitors of the renin-angiotensin system on clinical data including body weight (BW), albumin concentration, urinary albumin excretion rate (UAER), and renin plasma concentration data are shown as mean ± SD.
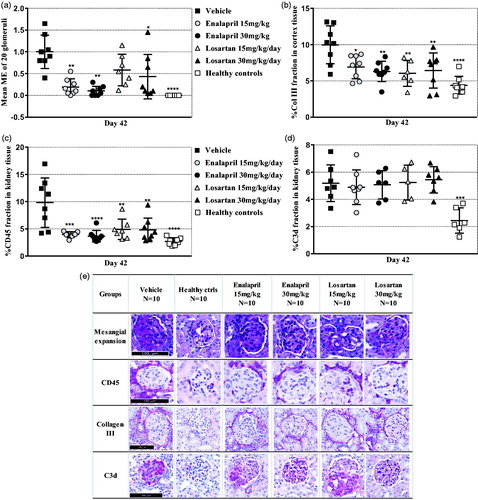
Figure 5. Effect of inhibitors of the renin-angiotensin system on histopathology. (A) Scatter plot is showing the mean glomerular mesangial expansion (ME) score. (B) Scatter plot is showing semi-quantification of collagen III positive area of the cortex area. (C) Scatter plot is showing semi-quantification of the CD45 positive area of the cortex area. (D) Scatter plot is showing semi-quantification of the C3d positive area of the cortex area. (E) Representative histopathological images. Data are shown as mean ± SD. *p < .05, **p < .01, ***p < .001, ****p < .0001 groups vs. vehicle group by one-way ANOVA using Tukey’s multiple comparisons test or Kruskal–Wallis multiple testing (n = 10).