Figures & data
Table 1. The primers used for real-time PCR analysis.
Figure 1. Effects of Curcumin pretreatment on renal function following renal I/R-induced injury. Serum creatinine and BUN were measured to assess the reno-protective effect of Cur against renal I/R. Data are represented as mean ± SEM (n = 10). ***p < .001 (IRI vs. Sham); #p < .005 (IRI vs. Cur).
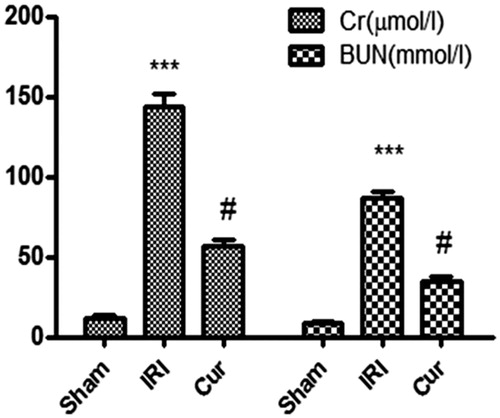
Figure 2. Effects of Curcumin pretreatment on I/R-induced renal histology. Representative microphotographs were taken from the kidneys of the sham, IRI, and Cur groups at the time point of 24 h after renal I/R. Histopathological examination was performed using PAS staining. Semi-quantitative assessment of the histological lesions based on tubular necrosis (B). Data are represented as mean ± SEM (n = 10). ***p < .001 (IRI vs. Sham); #p < .001 (IRI vs. Cur).
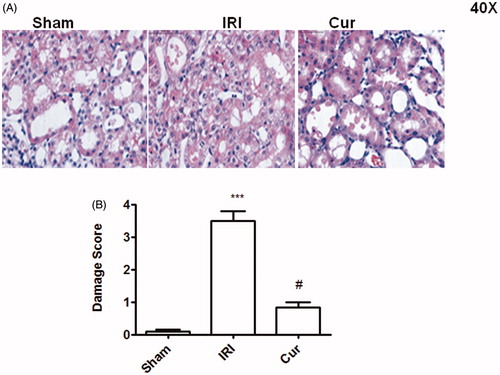
Table 2. Effects of curcumin pretreatment on the mRNA level of TNF-α, IL-6, and IL-8 in the kidney after renal ischemia-reperfusion injury.
Table 3. Effects of curcumin pretreatment on the expression of TNF-α, IL-6, and IL-8 in the serum after renal ischemia-reperfusion injury.
Figure 3. Effects of Curcumin pretreatment on the expression of p65 and p-p65 after renal ischemia-reperfusion injury. Western blot analysis was employed to the expression of p65 and p-p65. (A) A representative result for Western blot analysis p65. (B) Semi-quantitative analysis of 10 animals studied in each group. The relative amounts of p-p65 and p65 in each group of rats were normalized by β-actin and presented as a ratio between p-p65 and p65. *p < .05 (IRI vs. Sham); #p < .05 (Cur vs. IRI).
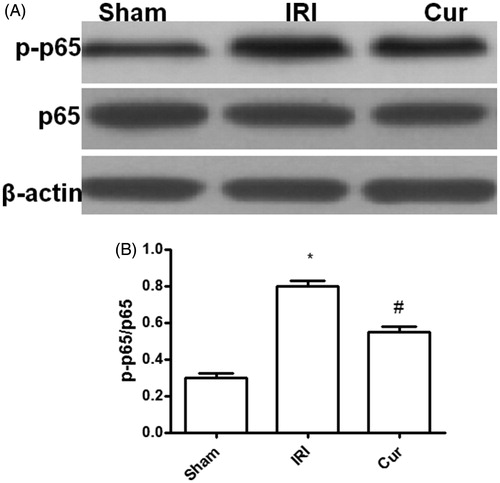
Figure 4. Effects of Curcumin pretreatment on the JAK2/STAT3 signaling after renal ischemia-reperfusion injury. Western blot analysis was employed to the expression of JAK2, p-JAK2, STAT3, and p-STATA3. (A) A representative result for Western blot analysis p-JAK2, STAT3, and p-STATA3. (B) Semi-quantitative analysis of 10 animals studied in each group. The relative amounts of p-JAK2, JAK2, STAT3, and p-STATA3 in each group of rats were normalized by β-actin and presented as a ratio between p-JAK2/JAK2 and p-STAT3/STAT3. *p<.05 (IRI vs. Sham); #p<.05 (Curcumin vs. IRI). (IRI vs. Sham); #p<.05 (Cur vs. IRI).
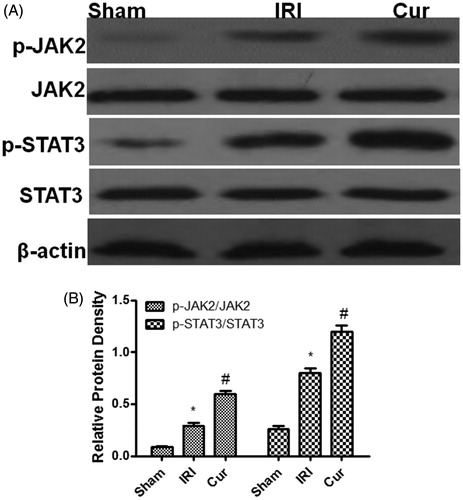
Figure 5. The structure of curcumin.