Figures & data
Table 1. One hundred and thirteen significant proteins were identified between control and calcification group by LFQ analysis.
Figure 1. Clustering heatmap of the significant proteins in comparison of CAL – control. If the number of proteins to be shown exceeds a specific value, no protein names would be drawn. Missed values are indicated with '–'. The group of control and CAL has three repeats, respectively.
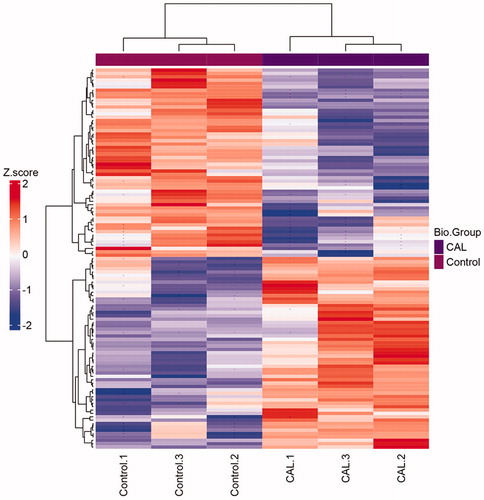
Figure 2. Volcano plot showing proteomics data. These points indicates different proteins that display both large magnitude fold-changes (x axis) and high statistical significance ( -log10 of p values, y axis). Dashed horizontal line shows the p values cutoff, and the two vertical dashed lines indicate down/up regulated proteins. Transparent points in the significant region mean these proteins do not satisfy some other conditions.
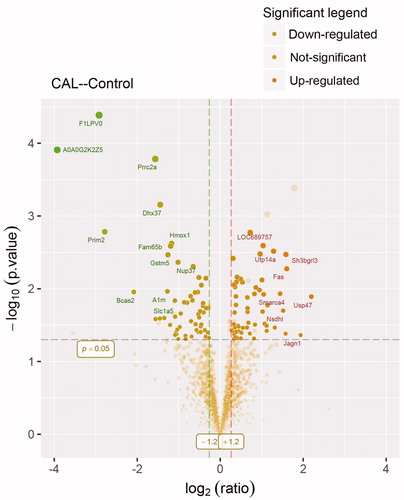
Figure 3. Bioinformatics results analysis. (A) Enriched GO items. Top axis is log10 (adjust p values), bottom axis is gene count. The ontology covers two domains. Molecular function: the elemental activities of these significant proteins at the molecular level are cell adhesion molecule binding. Biological process: these differentially expressed proteins are mainly involved in the placenta blood vessel development and liver regeneration. (B) STRINGdb protein-protein network enrichment analysis. The protein-protein interaction network of significant proteins is shown. The interactions include direct (physical) and indirect (functional) associations; they stem from computational prediction, from knowledge transfer between organisms, and from interactions aggregated from other (primary) databases.
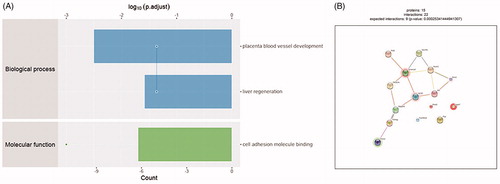
Figure 4. Renal pathological parameters in calcified rats. (A) Renal phenotype of calcified rats. It showed renal hypertrophy, pale color and uneven surface. (B) Comparison of urine protein between calcified rats and normal rats. The urine protein of the calcified group was significantly higher than that in the normal group. With the extension of modeling time, the change is more obvious. (C) Comparison of serum urea nitrogen between calcified rats and normal rats. The serum urea nitrogen concentration in the calcified group was significantly higher than that in the normal group, and the difference was statistically significant. (D) Comparison of serum creatinine between calcified rats and normal rats. The serum creatinine concentration in the calcified group was significantly higher than that in the normal group, and the difference was statistically significant. (E) The calcium deposition of renal and vascular. Masson staining showed a large amount of deposits in renal interstitial tissue calcified aorta (it indicates collagen hyperplasia). The von Kossa staining showed a large amount of black particle deposits in the renal interstitial tissue and calcified aorta (black deposits indicate calcium deposition).
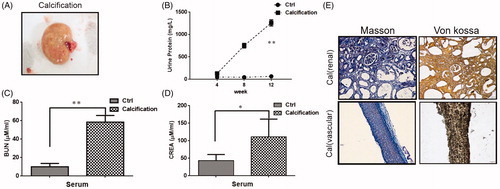
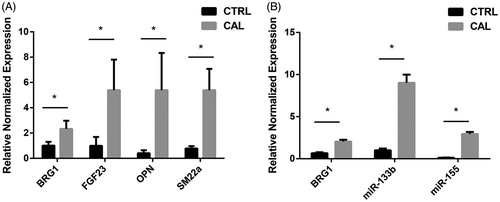
Figure 5. (A) Real-time PCR analysis. The relative normalized expression of Smarca4, miR-155 and miR-133b between normal control group and VC group. (B) The relative normalized expression of Smarca4, FGF23, OPN and SM22α between normal control group and VC group.