
Figures & data
Table 1. Baseline clinical characteristics of total patients and patients stratified by values below and above the median NLR.
Table 2. Relationships between NLR and clinical parameters.
Figure 1. Kaplan–Meier curves with log-rank tests of freedom from composite outcomes. Data were stratified according to the values below and above the median NLR. Solid line showed low NLR group’s Kaplan–Meier curve and dashed line showed high NLR group’s one.
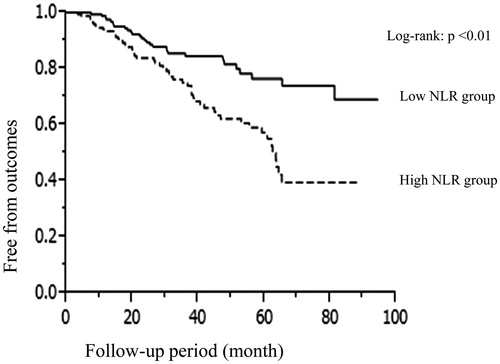
Table 3. Hazard ratios for renal outcomes of high neutrophil count, low lymphocyte count, and high NLR groups by the Cox proportional hazard model.