Figures & data
Table 1. qRT-PCR Primer sequences for mice.
Table 2. qRT-PCR Primer sequences for HUVECs.
Figure 1. Serum TNF-α levels of mice after LPS stimulation. TNF-α−/− and WT mice (n = 6) were injected with LPS. After 6 h, the blood samples were collected from the mice and examined using an ELISA kit for TNF-α (p = 0.0000).
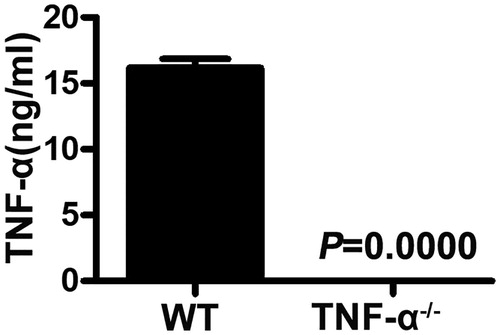
Figure 2. Effects of Cd on vWF and occludin gene expression in TNF-α−/− and WT mice. Relative mRNA expressions of vWF (A) and occluding (C) in the kidneys from WT mice treated with CdCl2 for 4 days were determined by using qRT-PCR (n = 3). Relative mRNA expression of vWF (B) (p = 0.0057) and occludin(D) (p = 0.0002) in the kidney from TNF-α−/− mice treated with CdCl2 for 4 days were determined by using qRT-PCR (n = 3).
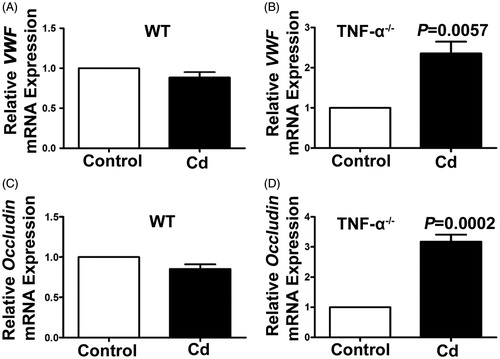
Figure 3. Effects of Cd on vWF protein expression in glomeruli from TNF-α−/− and WT mice. Representative images of vWF immunofluorescent staining in glomeruli of WT mice (A) and TNF-α−/− mice (B). Representative result of vWF expression in WT mice (C) and TNF-α−/− mice (D) using immunohistochemistry.
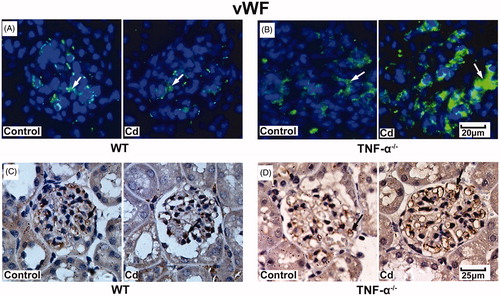
Figure 4. Effects of Cd on occludin protein expression in glomeruli from TNF-α−/− mice and WT mice. Representative result of occludin expression in WT mice (A) and TNF-α−/− mice (B) using immunofluorescence. Representative result of occludin expression in WT mice(C) and TNF-α−/− mice (D) using immunohistochemistry.
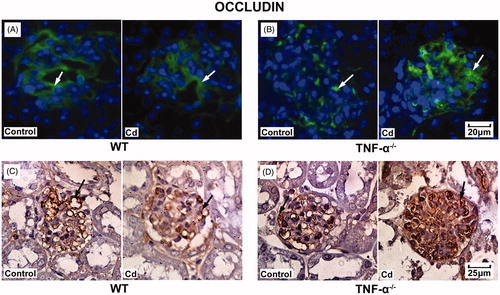
Figure 5. Expression of TNF-α, vWF, and occludin in HUVECs after TNF-α siRNA transfection. (A) Relative mRNA expression of TNF-α in HUVECs was determined using qRT-PCR (n = 3, p = 0.00007). Relative mRNA expression of vWF (B) and occludin (C) in HUVECs was determined by using qRT-PCR (n = 3).
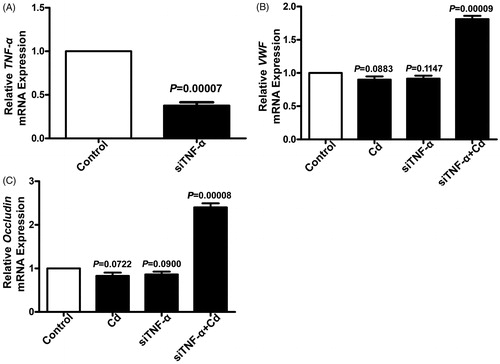
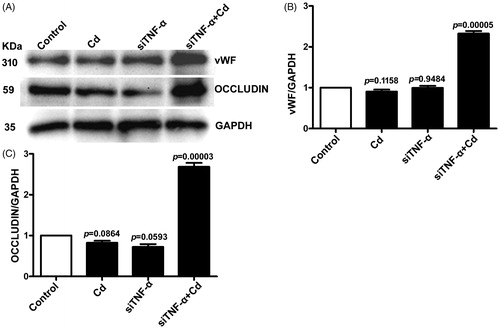
Figure 6. Effects of Cd on vWF and occludin protein expressions in HUVECs after siTNF-α transfection. The nontreatment samples were used as the control and GAPDH was used as loading control. (A) Representative blots of vWF, occludin and GAPDH; (B) Densitometry analysis of vWF/GAPDH; (C) Densitometry analysis of occludin/GAPDH.