Figures & data
Figure 1. Diabetes aggravates renal ischemia and reperfusion injury. (A) Representative H&E images of renal tissues (magnification, ×400), arrows indicate tubular necrosis. (B) Histopathological scoring. (C) BUN concentration. (D) SCr concentration. (E) MDA content in kidney tissues. (F) SOD activity in kidney tissues. (G) TNF-α level in kidney tissues. (H) IL-1β level in kidney tissues. The results are presented as mean ± SD. *p < .05.
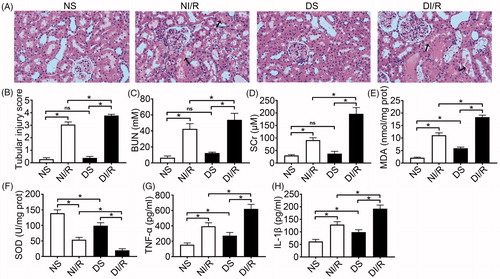
Table 1. General characteristics of rats 8 weeks after STZ injection.
Figure 2. Diabetes promotes I/R-induced apoptosis of renal tubular epithelial cells. (A and B) Renal apoptosis was detected by TUNEL assay. (A) Representative fluorescence microscopy images (magnification, ×400) and (B) quantitative analysis for TUNEL staining. (C–F) The expression of apoptosis-related proteins was examined by western blotting. (C) Representative blots and quantitative analysis of western blotting for (D) Bax, (E) cleaved caspase-3, and (F) Bcl-2. The results are presented as mean ± SD. *p < .05.
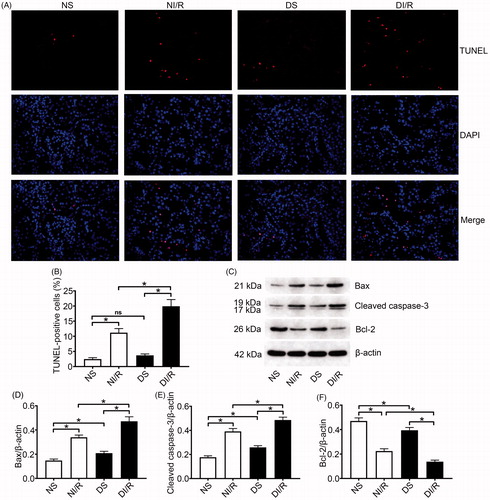
Figure 3. Diabetes blocks the Nrf2/HO-1 pathway and amplifies NF-κB signaling after I/R. (A) Representative western blotting images and quantification of protein levels of (B) Nrf2, (C) HO-1, (D) TLR4, and (E) NF-κB. The results are presented as mean ± SD. *p < .05.
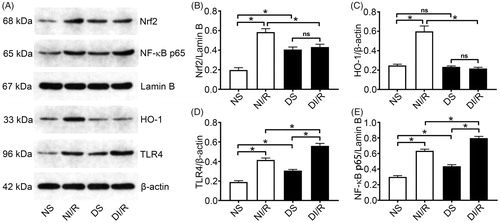
Figure 4. TBHQ pretreatment alleviates acute kidney injury, oxidative stress, and inflammatory responses after I/R in diabetic rats. (A) Representative images of H&E staining of renal tissues (magnification, ×400), arrows indicate tubular necrosis. (B) Histopathological scoring. (C) BUN concentration. (D) SCr concentration. (E) MDA content in kidney tissues. (F) SOD activity in kidney tissues. (G) TNF-α level in kidney tissues. (H) IL-1β level in kidney tissues. The results are presented as mean ± SD. *p < .05.
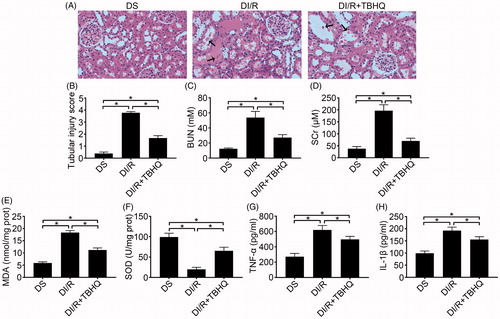
Figure 5. TBHQ pretreatment reduces I/R-induced apoptosis in renal tubular epithelial cells in diabetic rats. (A and B) Renal apoptosis was detected by TUNEL assay. (A) Representative fluorescence microscopy images (magnification, ×400) and (B) quantitative analysis of TUNEL staining. (C–G) The expression of apoptosis-related proteins was examined by western blotting. (C) Representative blots and quantitative analysis of western blotting for (D) total caspase-3, (E) cleaved caspase-3, (F) Bax, and (G) Bcl-2. The results are presented as mean ± SD. *p < .05.
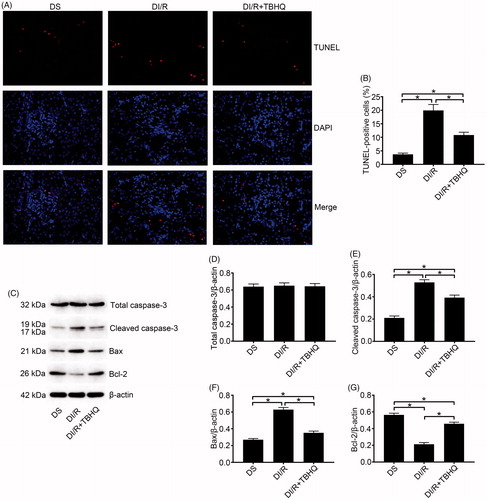
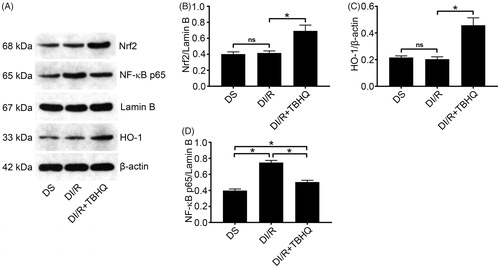
Figure 6. TBHQ pretreatment activates the Nrf2/HO-1 pathway and inhibits NF-κB expression after I/R in diabetic rats. (A) Representative western blotting images and quantification of protein levels of (B) Nrf2, (C) HO-1, and (D) NF-κB. The results are presented as mean ± SD. *p < .05.