
Figures & data
Figure 1. Flowchart of the study selection procedure.
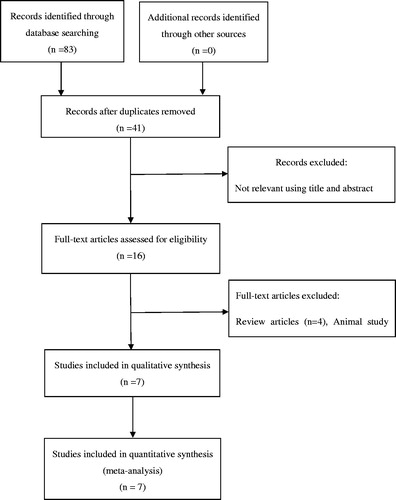
Table 1. Main characteristics of studies included in the meta-analysis.
Table 2. Quality assessment for all of the included studies.
Figure 2. Forest plot of the studies assessing the association between AHR rs2066853 gene polymorphisms and male infertility based on allelic model (allele model: A vs. G).
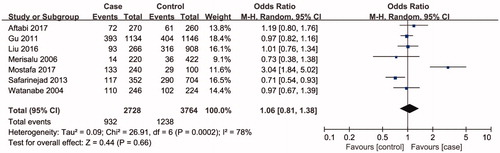
Figure 3. Forest plot of the studies assessing the association between AHR rs2066853 gene polymorphisms and male infertility based on additive model (additive model: AA vs. GG).
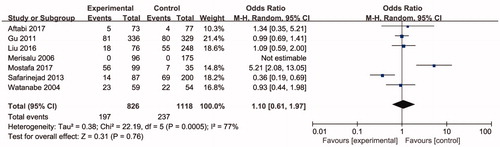
Figure 4. Forest plot of the studies assessing the association between AHR rs2066853 gene polymorphisms and male infertility based on recessive model (recessive model: AA vs. GG + GA).
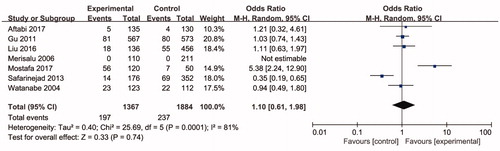
Figure 5. Forest plot of the studies assessing the association between AHR rs2066853 gene polymorphisms and male infertility based on dominant model (dominant model: AA + GA vs. GG).
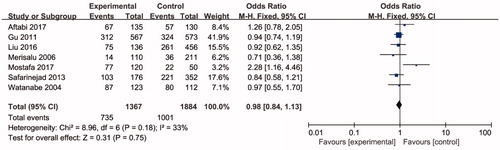
Table 3. Meta-analysis of the association of AHR rs2066853 gene polymorphisms with male infertility.
Figure 6. Funnel plot of the studies assessing the association between AHR rs2066853 gene polymorphisms and male infertility (allele model: A vs. G; additive model: AA vs. GG; recessive model: AA vs. GG + GA; dominant model: AA + GA vs. GG).
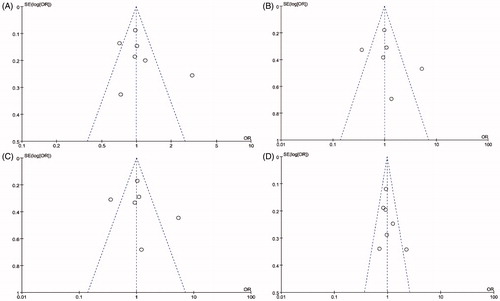
Figure 7. Sensitivity analysis diagram for each study used to assess the relative risk estimates for the AHR rs2066853 gene polymorphisms and male infertility in all the included studies (allele model: A vs. G; additive model: AA vs. GG; recessive model: AA vs. GG + GA; dominant model: AA + GA vs. GG).
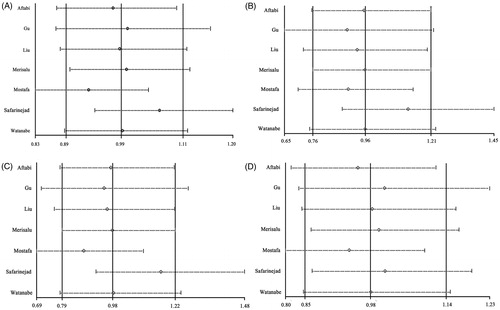
Table 4. Publication bias test for the AHR rs2066853 gene polymorphism.