Figures & data
Table 1. H. pylori infection rate in the two groups.
Figure 1. H. pylori-negative and H. pylori-positive subjects in two groups. Both 14C-urea breath test and rapid urease tests were utilized for identifying H. pylori infection in healthy controls and patients with peptic ulcer (IR: infection rate, **p<.01 vs. healthy control).
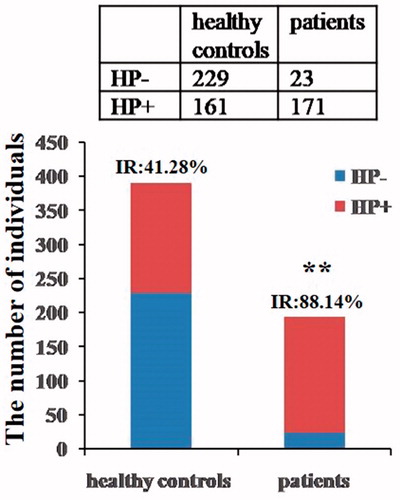
Table 2. The H. pylori infection and urine ACR in healthy controls.
Table 3. The urinary ACR and H. pylori infection in patients with peptic ulcer.
Table 4. The H. pylori infection severity level and urinary ACR abnormal severity.
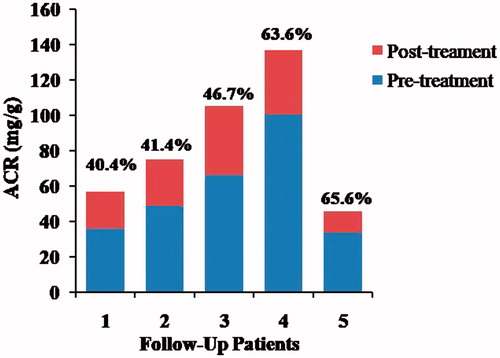
Figure 2. The urinary ACR between pretreatment and post-treatment in H. pylori infection patients with peptic ulcer. ACR of five subjects was significantly decreased after 3 month routine H. pylori eradication therapy by urine ACR test.