
Figures & data
Table 1. Clinical variable of the 70 PD patients in the normal or low ABI group.
Figure 1. Receiver operating characteristic (ROC) curve analysis to predict PAD of 70 PD patients. The area under the ROC curve (AUC) indicates the diagnostic power of OPG at predicting PAD of PD patients.
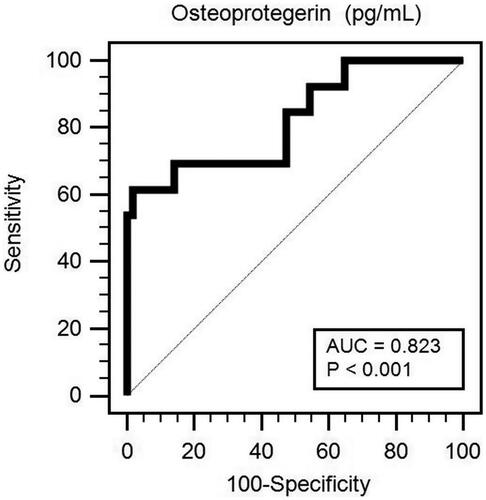
Table 2. Risk factors for the development of PAD of PD patients.