
Figures & data
Figure 1. The Helicobacter pylori infection rates in IgA nephropathy patients and healthy controls. IgAN: IgA nephropathy; H. pylori: Helicobacter pylori.
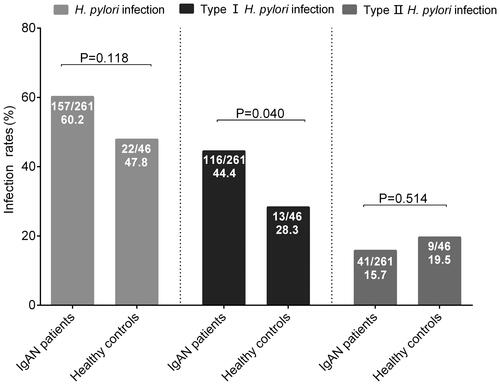
Table 1. Association of H. pylori infection and clinical manifestation in patients with IgA nephropathy.
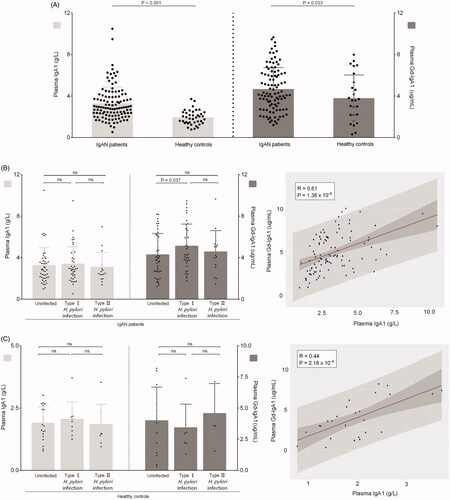
Figure 2. Levels of plasma IgA1 and galactose-deficient IgA1 in participants. (A) The plasma IgA1 and Gd-IgA1 levels in patients with IgAN and healthy controls. (B) The Plasma IgA1 and Gd-IgA1 levels in IgAN patients with or without H. pylori infection. (C) The Plasma IgA1 and Gd-IgA1 levels in healthy controls with or without H. pylori infection.
Supplemental material