
Figures & data
Table 1. Baseline clinical characteristics and histopathologic features of 642 IgAN patients at the time of renal biopsy.
Figure 1. Kaplan–Meier analysis for the survival probability of the composite endpoint by C4 groups.
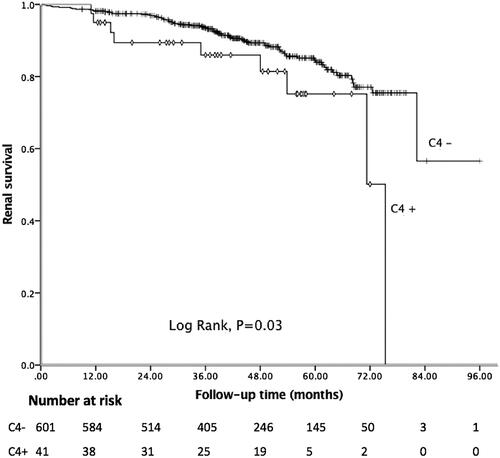
Figure 2. Kaplan–Meier analysis for the survival probability of the composite endpoint by different G-scores.
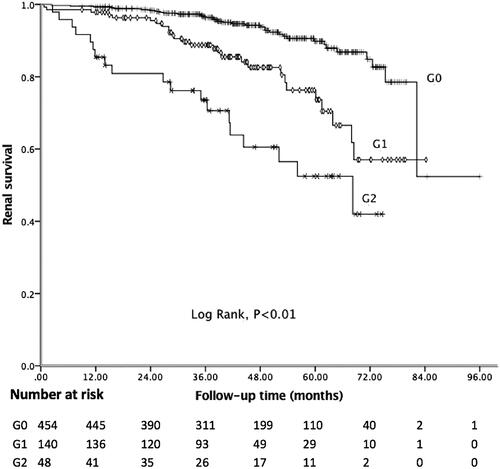
Figure 3. Kaplan–Meier analysis for the survival probability of the composite endpoint by different C-scores.
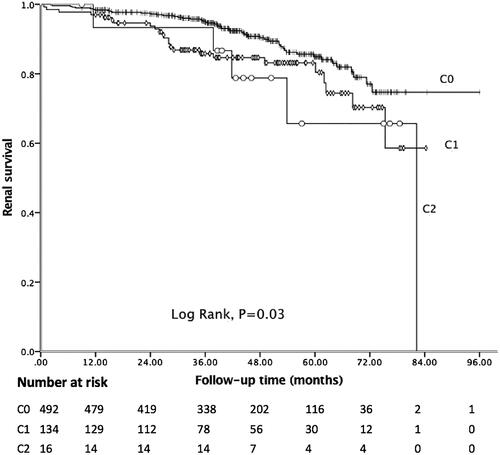
Table 2. Univariate Cox regression analyses for the risk factors of renal survival.
Table 3. Multivariate Cox regression analyses for the risk factors of renal survival.
Supplemental material