
Figures & data
Table 1. Characteristics of all PD patients with peritonitis during the study period, from 2011 to 2019.
Table 2. Comparisons of the clinical manifestations and predisposing factors for patients during different seasons.
Figure 1. Changes in the peritonitis rate at the Second Affiliated Hospital of Suzhou University, from 2011 to 2019.
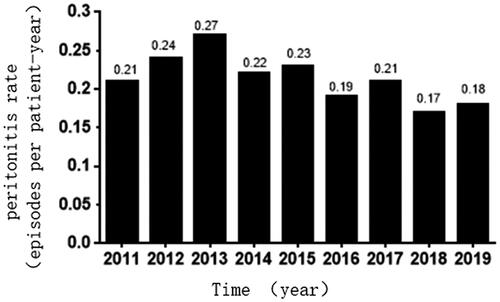
Table 3. Overall peritonitis rate for different seasons (episodes/patient-year).
Figure 2. The incidence of peritonitis and varying temperatures during different seasons, from 2011 to 2019.
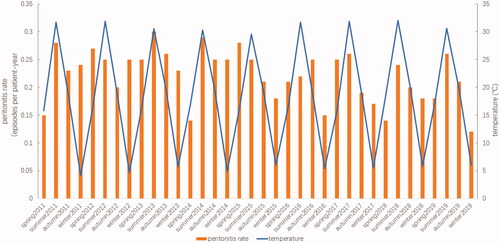
Figure 3. Incidence of peritonitis and humidity changes during different seasons, from 2011 to 2019.
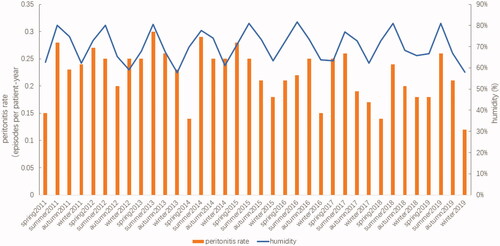
Table 4. Microbiologic causes of peritonitis.
Table 5. Relationships between microorganisms and seasonal variations.
Figure 4. Relationships between the gram-negative bacterial peritonitis rate and average temperature and average humidity.
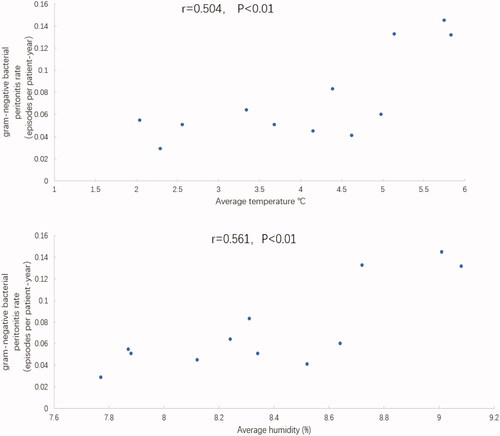
Figure 5. Relationships between the enterobacterial peritonitis rate and the average temperature and average humidity.
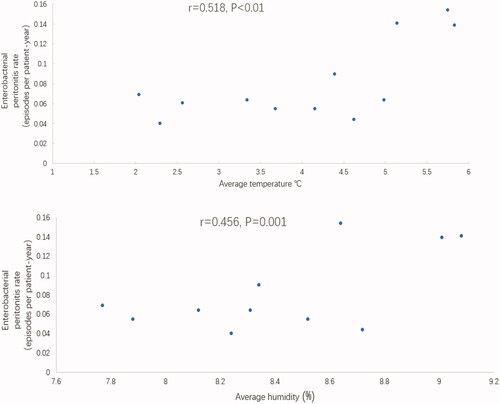
Table 6. Logistic univariate regression analysis for peritonitis.
Table 7. Logistic multivariate regression analysis for peritonitis.
Table 8. Clinical outcomes of peritonitis, according to the four seasons [(Case %)].