Figures & data
Table 1. Characteristics of the studied population with comparison of patients with STEMI and NSTEMI.
Table 2. Comparison of patients with and without chronic kidney disease.
Table 3. Comparison of patients with and without contrast-induced acute kidney injury.
Table 4. Comparison of dead and alive patients.
Table 5. Spearman’s correlation rank between eGFR change rate and biochemical results.
Table 6. Multivariable logistic regression forward stepwise Wald method – risk ratio for risk of post-contrast acute kidney injury.
Table 7. Multivariable logistic regression forward stepwise Wald method –risk ratio for risk of death – all population.
Table 8. Multivariable logistic regression forward stepwise Wald method – risk of death in NSTEMI population.
Table 9. Multivariable logistic regression forward stepwise Wald method – risk of death in STEMI population.
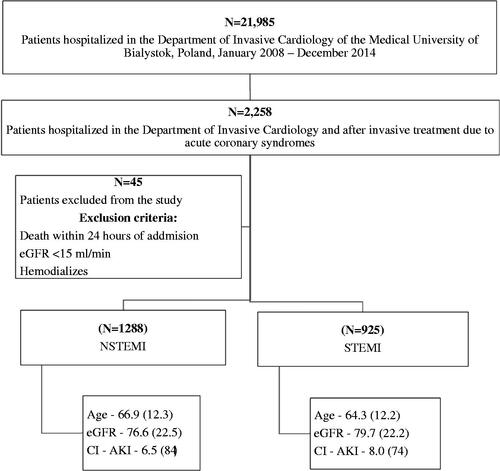
Figure 1. Selection of study population.