
Figures & data
Table 1. Clinical features and laboratory data of the study population.
Table 2. Distribution of glycosuria levels in ATIN and other diagnoses.
Figure 1. Receiver operating characteristic (ROC) curve for predicting acute tubulointerstitial nephritis from urine dipstick tests for glucose. AUC: the area under the ROC curve; CI: confidence interval.
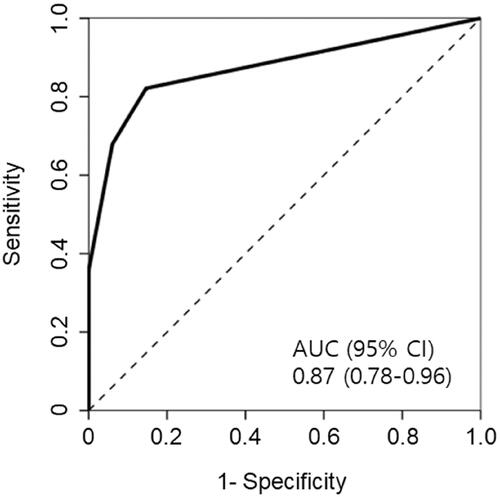
Table 3. Performance of the different cutoffs for glycosuria to predict ATIN.
Table 4. Blood chemistries suggestive of tubular injury.