
Figures & data
Table 1. The demographic data and neuropsychological test results for the HD patients and controls.
Table 2. Performance of the control group and the HD patients on subitems of the event based prospective memory tasks.
Table 3. Performance of the control group and HD patients on subitems of the TBPM tasks.
Figure 1. Participant flow diagram.
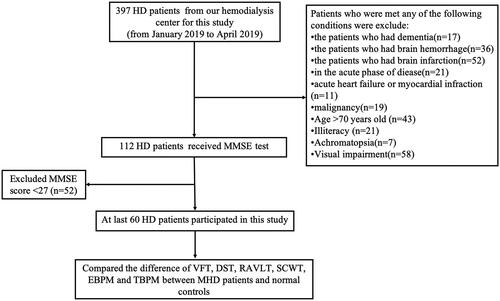
Figure 2. Mean number of clock checking responses in the control group and the HD patients group in each one minute period during the EBPM task.
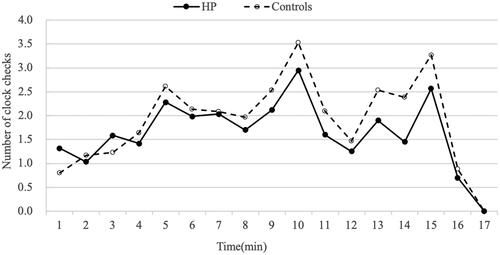
Table 4. Correlation analyses for the EBPM and TBPM score with demographics, clinical variables and neuropsychological parameters in HD patients.