
Figures & data
Figure 1. Enrollment flowchart and patient status. Low eGFR was defined as eGFR < 60 mL/min/1.73m2 and normal eGFR was defined as eGFR ≥ 60 mL/min/1.73m2. Abbreviations: CCU, cardiac care unit; eGFR, estimated glomerular filtration rate; AMI, acute myocardial infarction.
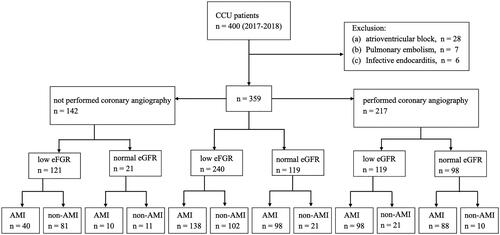
Table 1. Demographic and clinical characteristics of patients with moderate to severe renal insufficiency and normal kidney function.
Table 2. Clinical presentation of patients having elevated high-sensativity troponin-T.
Table 3. Final diagnoses of patients admitted to CCU and the corresponding levels of high-sensitivity troponin-T.
Figure 2. Receiver operating characteristic curves of high-sensitivity cardiac troponin-T (TnT) levels on admission, and dynamic changes in these levels for the diagnosis of acute myocardial infarction (diagnosis based on coronary angiography or cardiac echocardiography) (A) for patients with eGFR < 60 mL/min/1.73 m2, (B) patients with eGFR > 60 mL/min/1.73 m2, (C) patients with chronic kidney disease (CKD) history, and (D) patients without CKD history.
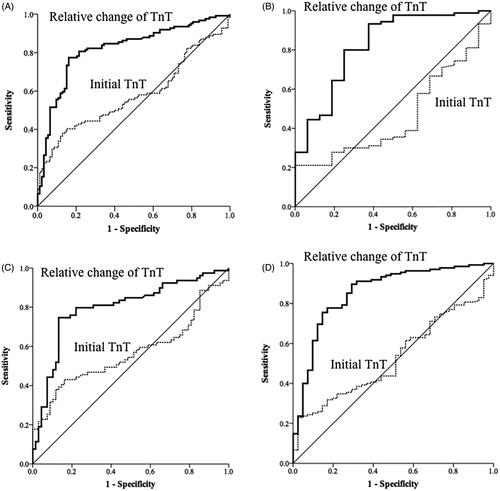
Figure 3. Receiver operating characteristic curves of high-sensitivity cardiac troponin-T (TnT) levels on admission and dynamic changes in these levels for the diagnosis of acute myocardial infarction (diagnosis based on coronary angiography only) (A) for patients with eGFR < 60 mL/min/1.73 m2, (B) patients with eGFR > 60 mL/min/1.73 m2, (C) patients with chronic kidney disease (CKD) history, and (D) patients without CKD history.
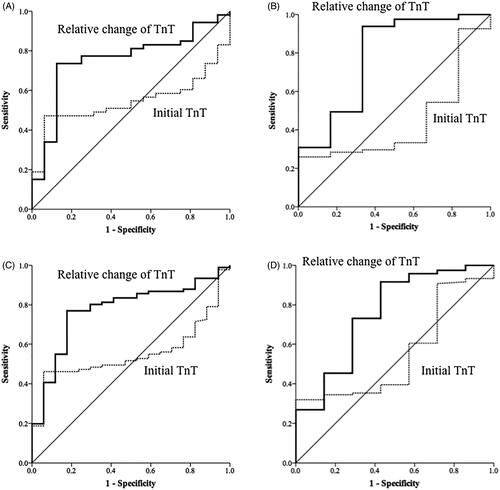
Table 4. Diagnostic performance of dynamic change for high-sensitivity cardiac troponin-T levels for the diagnosis of acute myocardial infarction.
Table 5. Optimal cutoff values for dynamic changes in high-sensitivity cardiac troponin-T levels for the diagnosis of acute myocardial infarction.
Table 6. Subgroup analyses of initial and relative change of high-sensitivity cardiac troponin-T for diagnosis performance of acute myocardial infarction.