Figures & data
Table 1. Demographics and baseline clinical characteristics of participants prior to receiving hemodialysis for end-stage renal disease (N = 100).
Table 2. Comparison of saliva variables before (pre-dialysis), during (mid-dialysis), and 1 h after completion of dialysis (post-dialysis) for participants (N = 100).
Table 3. Differences in saliva flow rate by interdialytic weight gain (IDWG).
Figure 1. Participants’ changes in pH at each time point Participants’ changes in osmo at each time point.
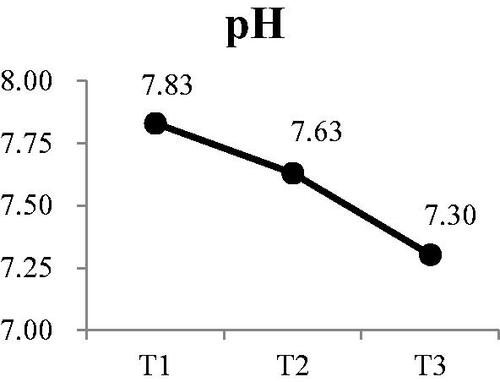
Figure 2. Participants’ changes in sodium at each time point Participants’ changes in potassium at each time point.
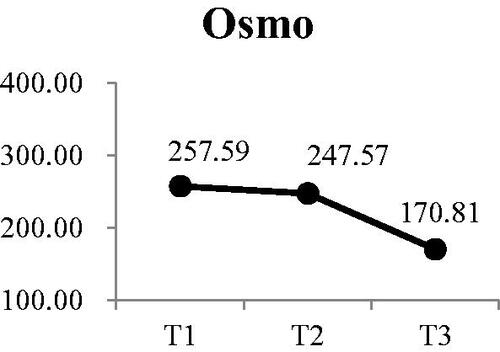
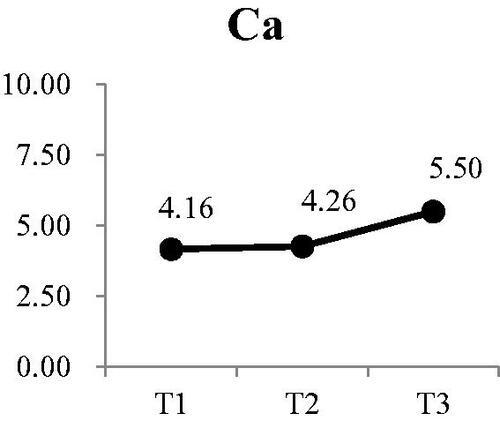
Figure 3. Participants’ changes in chloride at each time point Participants’ changes in calcium at each time point.
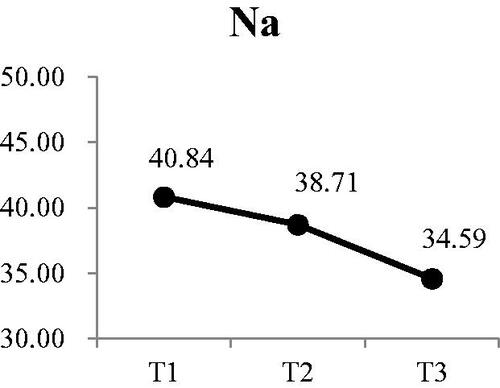
Figure 4. Participants’ changes in potassium at each time point.
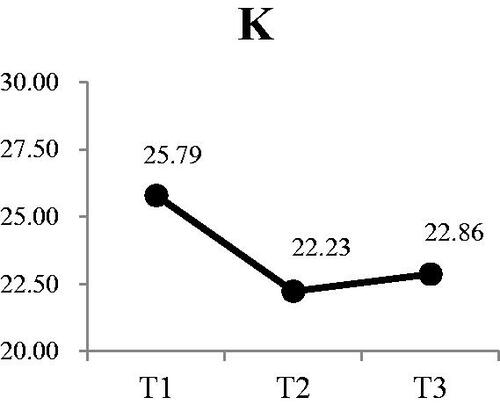
Figure 5. Participants’ changes in chloride at each time point.
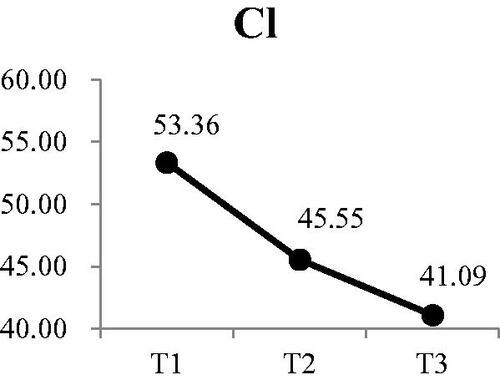
Figure 6. Participants’ changes in calcium at each time point.