
Figures & data
Table 1. Components of the Yishen capsule and their scientific (Latin binomial nomenclature) names.
Figure 1. Effects of Yishen capsule on physiological index in rats with DN. (A) 24-h urine output; (B) Water intake; (C) Random blood glucose level; (D) 24 h urinary total protein (24 h UTP). Values are presented as the mean ± SD. n = 8–10. **p < 0.01; ***p < 0.001.
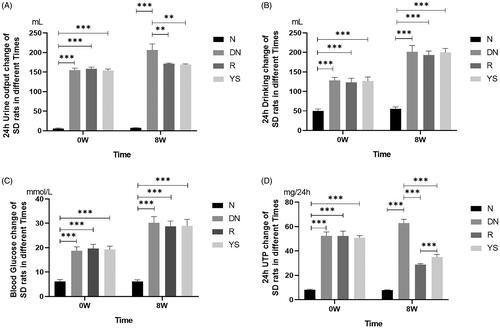
Figure 2. Effect of Yishen capsule on histological changes in the kidney of rats. (A) Representative histological images of sections from different groups at 100× and 200× magnification using an optical microscope. (B) Renal pathological scores. Values are presented as the mean ± SD. n = 10.

Table 2. Renal pathological scores.
Figure 3. Effects of Yishen capsule on the expression of SIRT1, acetylated NF-κB p65, NF-κB p65, LC3-II, and Beclin-1 in the kidney of rats. (A) Representative western blotting images showing the expression of SIRT1, acetylated NF-κB p65, LC3-II, and Beclin-1; (B) Quantification of SIRT1, acetylated NF-κB p65, NF-κB p65, LC3-II, and Beclin-1 expression. Values are presented as the mean ± SD. n = 3. *p < 0.05; **p < 0.01; ***p < 0.001.
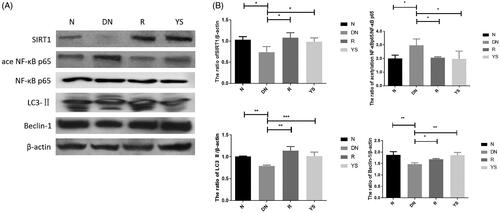
Figure 4. Expression of SIRT1 and LC3-II in immortalized mouse podocytes under normal glucose (NG), high glucose (HG), and mannitol isotonic (NG + M) conditions. (A) Representative western blotting bands corresponding to SIRT1, LC3-II, and β-actin. The expression trend of LC3II is indicated by the lower one of two bands in Western Blot, the upper band demonstrates the expression of LC3I. (B) Quantification of SIRT1 expression; (C) Quantification of LC3-II expression. Values are presented as the mean ± SD. n = 3. *p < 0.05; **p < 0.01.
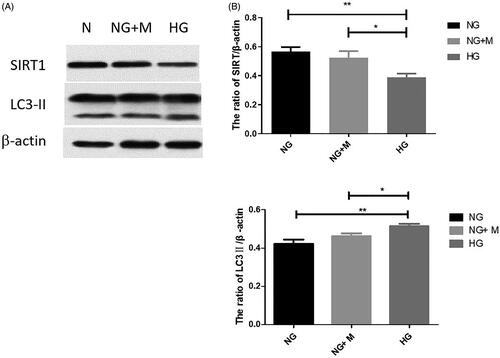
Figure 5. Effect of Yishen capsule serum on podocyte proliferation. Mouse podocytes were cultured under normal glucose (NG), high glucose (HG), high glucose + serum from low concentration of Yishen capsule (HG + LYS), high glucose + serum from medium concentration of Yishen capsule (HG + MYS) and high glucose + serum from high concentration of Yishen capsule (HG + HYS). Values are presented as the mean ± SD. n = 3. *p < 0.05.
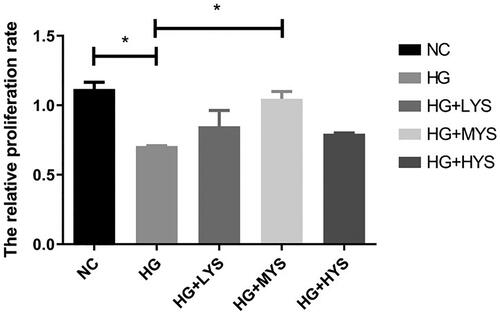
Figure 6. Effects of Yishen capsule serum on the expression of autophagy-related genes (i.e. Beclin-1 and LC3-II) under different interventions. NG = normal glucose, HG = high glucose, YS = Yishen capsule, R = resveratrol, and Ex = Ex-527. (A) Representative western blotting bands corresponding to Beclin-1 and LC3-II. (B) Quantification of Beclin-1 protein and mRNA. (C) Quantification of LC3-II protein and mRNA. Values are presented as the mean ± SD. n = 3. *p < 0.05; **p < 0.01; ***p < 0.001.
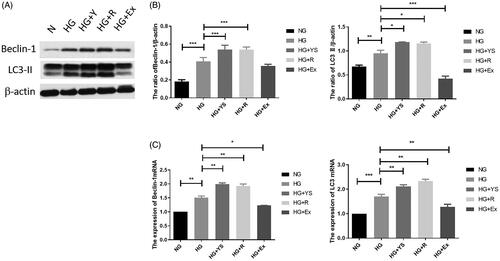
Figure 7. Expression of SIRT1, acetylated NF-κB p65, and nephrin under different culture conditions. NG = normal glucose, HG = high glucose, YS = Yishen capsule, R = resveratrol, and Ex = Ex-527. (A) Representative western blotting bands corresponding to SIRT1, acetylated NF-κB p65, and nephrin. (B) Quantification of protein levels of SIRT1, acetylated NF-kB p65, and nephrin. (C) Quantification of mRNA levels of genes. Values are presented as the mean ± SD. n = 3. *p < 0.05; **p < 0.01. ***p < 0.001.
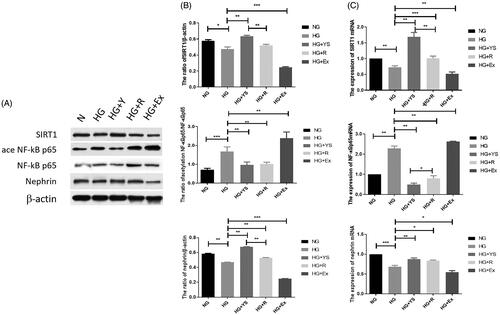
Figure 8. Representative immunofluorescence images showing enhanced nuclear translocation of SIRT1 in podocytes in the Yishen capsule serum and resveratrol groups and suppressed nuclear translocation of SIRT1 in the HG and SIRT1 inhibitor (Ex-527) groups. NG = normal glucose, HG = high glucose, YS = Yishen capsule, R = resveratrol, and Ex = Ex-527.
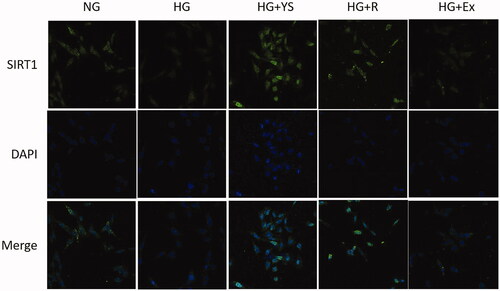
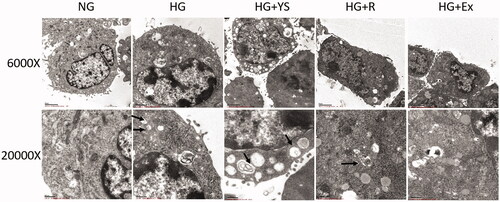
Figure 9. Representative transmission electron microscopic (TEM) images of podocytes under different culture conditions. NG = normal glucose, HG = high glucose, YS = Yishen capsule, R = resveratrol, and Ex = Ex-527. More autophagosomes are present in the HG treatment groups (i.e. HG, HG + Y, HG + R, and HG + E). Autophagosomes and vacuoles are increased in HG + Y and HG + R compared to that in the HG + E group. Images were captured at 6000 × (upper) and 20000 × (lower) magnification, respectively, with a transmission electron microscope. Black arrows indicate autophagosomes.
Data availability statement
The datasets generated and/or analyzed during the current study are not publicly available due to data sharing agreements but are available from the corresponding author on reasonable request.