Figures & data
Figure 1. Establishment of contrast induced acute kidney injury (CIAKI).
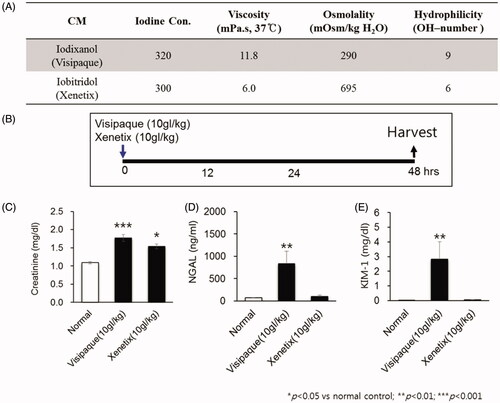
Figure 2. 15-Hydroxyprostaglandin dehydrogenase (15-PGDH) inhibition of contrast-induced acute kidney injury decreases the levels of renal injury biomarkers. (A) Arachidonic acid prostaglandin biosynthesis pathway and the biological activity of 15-PGDH inhibitor (SW033291). (B) Prostaglandin E2 (PGE2) levels in kidney tissue 1 h after intraperitoneal injection of 5 mg/kg SW033291 or a vehicle. (C) Experimental setup: mice received SW033291, PGE1, PGE2, or vehicle at 1 h before, immediately after, and 8, 16, and 24 h after administration of 10 gI/kg iodixanol. (D–F) Serum levels of creatinine, neutrophil gelatinase-associated lipocalin (NGAL), and kidney injury molecule-1 (KIM-1), respectively. Renal function was evaluated at 48 h after contrast medium (CM) injection. *p < 0.05; **p < 0.01; ***p < 0.001.
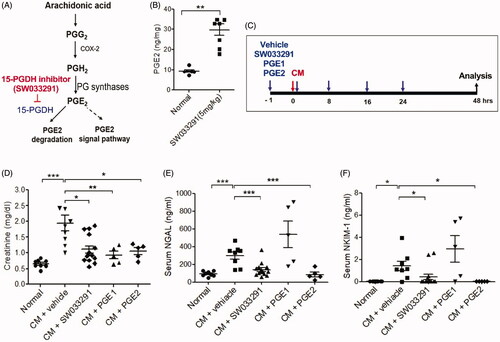
Figure 3. 15-Hydroxyprostaglandin dehydrogenase inhibition ameliorates renal tubular cell death in contrast-induced acute kidney injury mice. Before and after contrast medium (CM) administration, mice were injected intraperitoneally with a vehicle, SW033291 (15-PGDH inhibitor; 5 mg/kg), prostaglandin E1 (PGE1; 20 µg/kg), or PGE2 (5 mg/kg). Assessments were performed at 48 h after intravenous CM injection. (A) Representative gross appearances of the left and right kidneys of normal mice, and of those after injection with CM + vehicle, CM + SW033291, CM + PGE1, or CM + PGE2. Renal congestion in the outer medullary region is indicated by a black arrow. (B) Representative images of tubular injury in the outer zone of the renal medulla (hematoxylin and eosin staining). Scale bars in small panels, 500 μm and those in enlarged images, 50 μm. (C) Statistical analyses of tubular injury scores (n = 20 per group). (D) Representative images of apoptosis in the outer zone of the renal medulla (terminal deoxynucleotidyl transferase dUTP nick end labeling staining). Scale bars in small panels, 500 μm, those in enlarged images, 25 μm. (E) Statistical analyses of apoptosis (n = 20 per group). *p < 0.05; **p < 0.001.
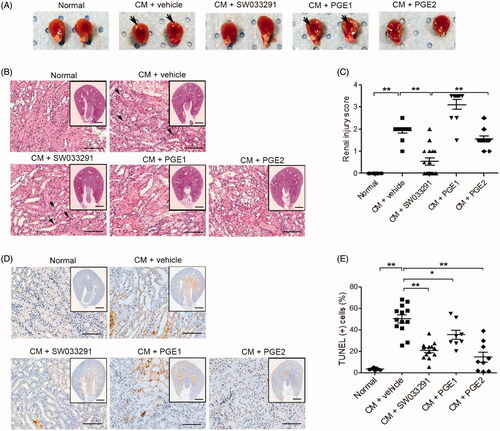
Figure 4. 15-Hydroxyprostaglandin dehydrogenase inhibitor effects on iodixanol-induced apoptosis in human renal proximal tubular epithelial cells (hRPTECs). hRPTECs were treated with SW033291 (15-PGDH inhibitor), prostaglandin E1 (PGE1), or PGE2 simultaneously with Visipaque® (iodixanol 50 mgI/mL). (A) Representative pictures of hRPTECs viability 24 h after Visipaque® (iodixanol 50 mgI/mL) treatment. (B) Quantification of hRPTEC viability by MTT assay. (C) Density plot of annexin V fluorescein isothiocyanate and propidium iodide (PI) expression in hRPTECs assessed by flow cytometry. (D) Quantification of hRPTECs apoptosis by flow cytometry; *p < 0.05; **p < 0.001. CM: contrast medium.
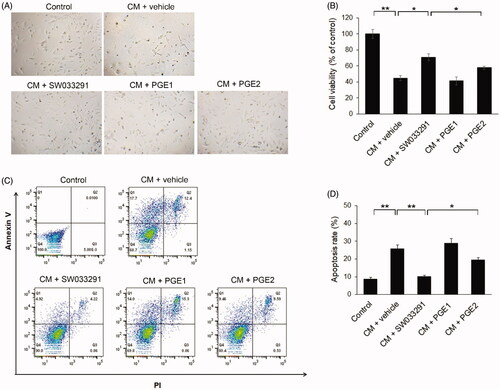
Figure 5. 15-Hydroxyprostaglandin dehydrogenase inhibition induces renal vasodilation in the outer medulla via the adenosine monophosphate (AMP)–adenosine signaling pathway. (A) Representative images of arterioles in the outer zone of the renal medulla. Magnified images are enlargements of the outlined areas. (B) Statistical analyses of the inner arteriole area of the outer medulla. (C) Statistical analyses of renal blood flow following administration of a vehicle, SW033291 (inhibitor), prostaglandin E1 (PGE1), or PGE2 in contrast-induced acute kidney injury mice. (D) Representative images of renal blood flux measurements of the study groups. (E,F) Statistical analyses of AMP and adenosine levels in kidney tissue. *p < 0.05; **p < 0.01; ***p < 0.001. Scale bars, 500 μm; scale bar in the enlarged image, 50 μm. CM: contrast medium.
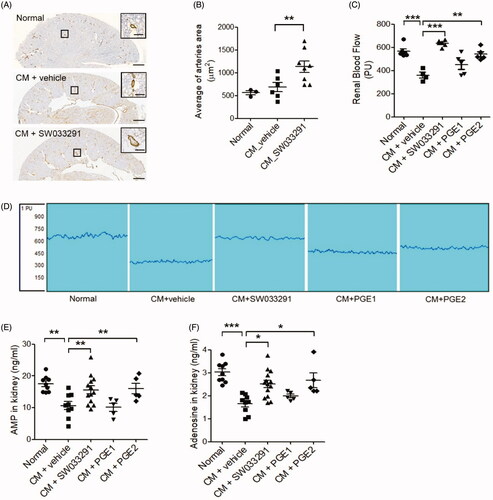
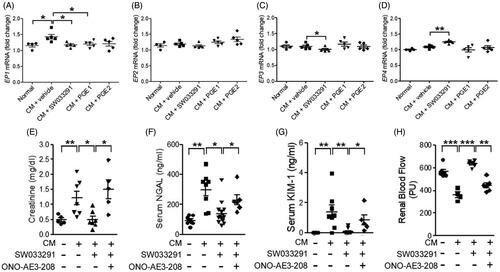
Figure 6. 15-Hydroxyprostaglandin dehydrogenase inhibition changes the level of prostaglandin E2 (PGE2) receptor (EP) expression in kidney tissue. The protective effects of the15-PGDH inhibitor, SW033291, can be blocked by an EP4 antagonist, ONO-AE3-208. (A–D) Statistical analyses of the EP expression level. (E–G) Serum levels of creatinine, neutrophil gelatinase-associated lipocalin (NGAL), and kidney injury molecule-1 (KIM-1) due to the absence or presence of ONO-AE3-208 in the contrast-induced acute kidney injury model. (H) Statistical analyses of renal blood flow. *p < 0.05; **p < 0.01; ***p < 0.001; CM: contrast medium.