Figures & data
Table 1. Primer sequences.
Figure 1. miR-34b-5p is highly expressed in septic AKI patients. Notes: (A) qRT-PCR detected the expression of miR-34b-5p in the serum of septic AKI patients and healthy volunteers; ELISA detected the serum levels of TNF-α (B), IL-1β (C), IL-6 (D), SCr (E), and BUN (F) in septic AKI patients and healthy volunteers; Pearson correlation coefficient measured the correlation between the expression level of miR-34b-5p and the levels of TNF-α (G), IL-1β (H), IL-6 (I), SCr (J), and BUN (K) in the septic AKI patients. **P < 0.01, compared to the normal group. AKI: acute kidney injury.
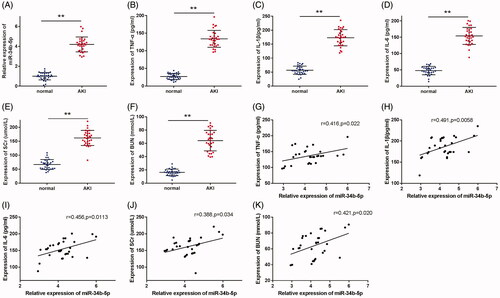
Figure 2. miR-34b-5p promotes LPS-induced apoptosis and inflammatory response in HK-2 cells. Notes: (A) qRT-PCR detected the expression of miR-34b-5p in LPS-induced HK-2 cells; **P < 0.01, compared to the control group. After transfection of miR-34b-5p inhibitor or miR-34b-5p mimic in LPS-induced HK-2 cells, (B) qRT-PCR detected the expression of miR-34b-5p in HK-2 cells; (C) TUNEL staining measured the apoptosis rate of HK-2 cells; (D) Western blotting detected the expressions of Bax, Bcl-2 and cleaved caspase-3 in HK-2 cells; ELISA measured the levels of TNF-α (E), IL-1β (F), and IL-6 (G) in the supernatant of HK-2 cells; scale bar = 50 μm; *P < 0.05, **P < 0.01, ***P < 0.001, compared to the control group, LPS + inhibitor NC group or LPS + mimic NC group. LPS: lipopolysaccharide.
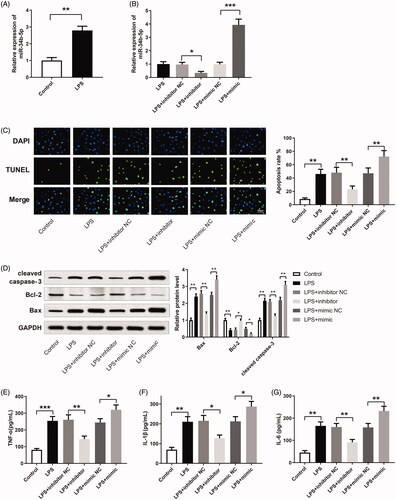
Figure 3. Overexpressing AQP2 suppresses LPS-induced apoptosis and inflammatory response in HK-2 cells. Notes: qRT-PCR (A) and Western blotting (B) detected the expression of AQP2 in LPS-induced HK-2 cells; **P < 0.01, compared to the control group. After transfection of pCDNA3.1-AQP2 in LPS-induced HK-2 cells, qRT-PCR (C) and Western blotting (D) detected the expression of AQP2 in the cells; (E) TUNEL staining measured the apoptosis rate of HK-2 cells; (F) Western blotting detected the expressions of Bax, Bcl-2 and cleaved caspase-3 in HK-2 cells; ELISA measured the levels of TNF-α (G), IL-1β (H). and IL-6 (I) in the cell supernatant; scale bar = 50 μm; *P < 0.05, **P < 0.01, ***P < 0.001, compared to the LPS + pcDNA3.1 group. LPS: lipopolysaccharide.
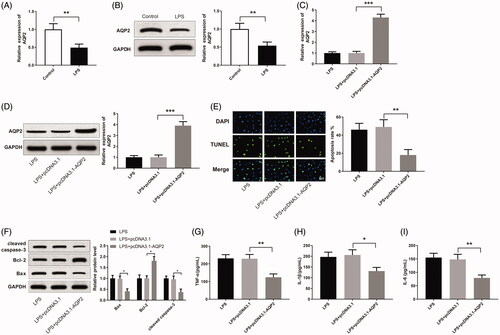
Figure 4. miR-34b-5p targets AQP2. Notes: (A) 3′UTR of AQP2 where miR-34b-5p binds to; (B) dual-luciferase reporter assay for verifying the targeting relationship between miR-34b-5p and AQP2; **P < 0.01, compared to the mimic NC + wt-AQP2 group. qRT-PCR (C) and Western blotting (D) detected the expression of AQP2 in LPS-induced HK-2 cells after transfection of miR-34b-5p inhibitor or miR-34b-5p mimic; *P < 0.05, **P < 0.01, compared to the LPS + inhibitor NC group or LPS + mimic NC group.
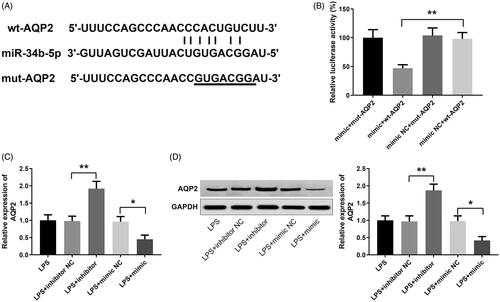
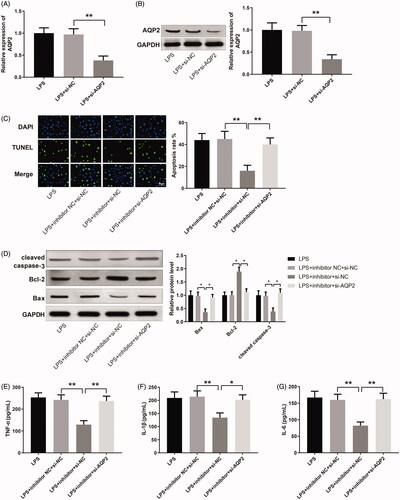
Figure 5. miR-34b-5p mediates LPS-induced apoptosis and inflammatory response in HK-2 cells by targeting AQP2. Notes: qRT-PCR (A) and Western blotting (B) detected the expression of AQP2 in LPS-induced HK-2 cells transfected with si-AQP2. After transfection of miR-34b-5p inhibitor + si-NC or miR-34b-5p inhibitor + si-AQP2 in LPS-induced HK-2 cells, (C) TUNEL staining assessed the cell apoptosis; (D) Western blotting measured the expressions of Bax, Bcl-2, and cleaved caspase-3 in HK-2 cells; ELISA measured the levels of TNF-α (E), IL-1β (F), and IL-6 (G) in the cell supernatant; scale bar = 50 μm; *p < 0.05, **p < 0.01, compared to LPS + inhibitor NC + si-NC group or LPS + inhibitor + si-NC group. LPS: lipopolysaccharide.