
Figures & data
Table 1. Demographic, clinical, and stone-related data.
Table 2. Renal function changes and perioperative outcomes.
Figure 1. The changes in mean estimated glomerular filtration rate (eGFR) levels in the prior stenting group and non-stenting group. Both groups had an increase in mean eGFR levels compared with baseline levels.
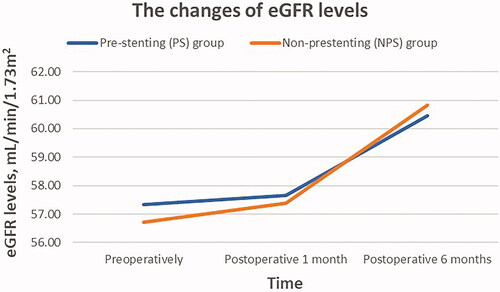
Table 3. The odds ratios (ORs) with 95% confidence interval (CIs) of renal function deterioration using univariable logistic regression.
Table 4. Multivariable logistic regression model for renal function deterioration at postoperative 6 months.
Supplemental material
Supplemental Material
Download PDF (97.8 KB)Data availability statement
The datasets used and/or analyzed during the current study are available from the corresponding author on reasonable request.