
Figures & data
Figure 1. Flow chart of the study design. Fifty two participants with CKD were separated into a progressive group and a stable group. CSVD (cerebral small vessel disease; enlarged VRS/WML/LI/CMB) comparisons were made between the two groups (progressive group at initial exam (group 1A), progressive group at follow-up (group 1B), stable group at initial exam (group 2A), stable group at follow-up (group 2B).
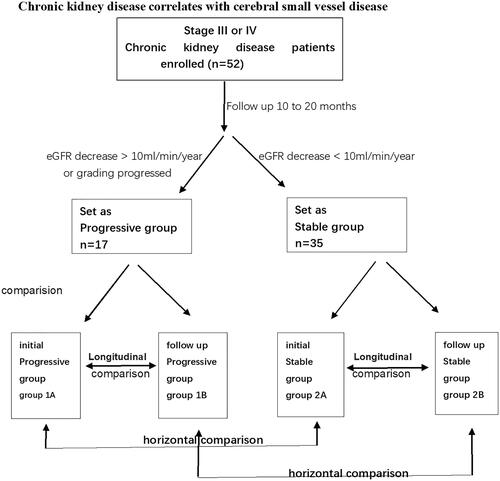
Table 1. Clinical data for participants (progressive group and stable group).
Figure 2. MR images from a 53-year-old male patient in the stable group at follow-up. Enlarged VRS (Virchow-Robin spaces) and LI (lacunar infarcts) lesions are shown. VRS hypersignal in T2W imaging and hyposignal in T1W images in the basal ganglia and centrum semiovale, VRS score 2 (according to the scale 0 = none, 1 = 1–10, 2 = 11–20, 3 = 21–40, and 4 = >40 by summing the basal ganglia and centrum semiovale VRS scores). LI was evaluated by hypersignal in T2/FLAIR images and hyposignal in T1W images located beside the lateral ventricle (white arrow).
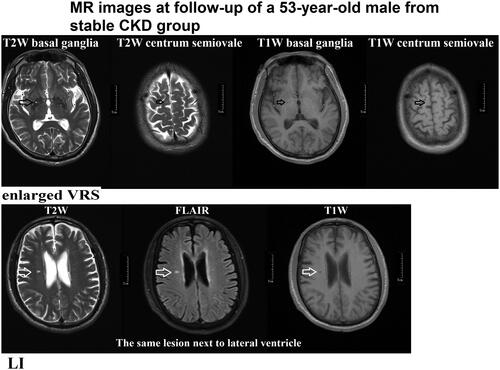
Figure 3. MR images from a 65-year-old patient from the progressive group at follow-up. WML (white matter lesions) and CMB (cerebral microbleeds) lesions are shown. WML surrounding the ventricle received Fazekas scale 2 points (fusion lesion) (T2W/FLAIR/T1W images) (black arrow). CMB lesions involved cortical, subcortical, and thalamic regions (white arrow) (magnitude image/phage image/SWI images).
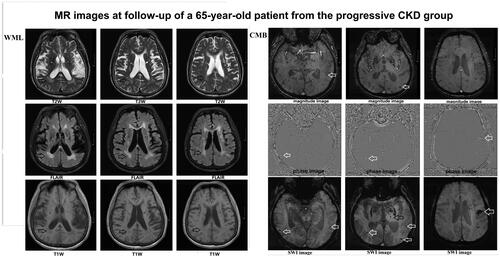
Table 2. MR evaluation of CSVD VRS (Virchow-Robin spaces) results and comparisons between two groups [progressive group at initial exam (group 1A), progressive group at follow-up (group 1B), stable group at initial exam (group 2A), stable group at follow-up (group 2B)].
Table 3. MR evaluation of CSVD WML (white matter lesions) results and comparisons between two groups [progressive group at initial exam (group 1A), progressive group at follow-up (group 1B), stable group at initial exam (group 2 A), stable group at follow-up (group 2B)].
Table 4. MR evaluation of CSVD LI (lacunar infarcts) results and comparisons between two groups [Progressive group at initial exam (group 1 A), Progressive group at follow-up (group 1B), Stable group at initial exam (group 2 A), Stable group at follow-up (group 2B)].
Table 5. MR evaluation of CSVD CMB (cerebral microbleeds) results and comparisons between two groups [progressive group at initial exam (group 1A), progressive group at follow-up (group 1B), stable group at initial exam (group 2A), stable group at follow-up (group 2B)].
Figure 4. The mean CSVD scores of VRS (Virchow-Robin spaces)/WML (white matter lesions)/LI (lacunar infarcts)/CMB (cerebral microbleeds) and comparison between the two patient groups [progressive group at initial exam (group1A), progressive group at follow-up (group 1B), stable group at initial exam (group 2A), stable group at follow-up (group 2B)].
![Figure 4. The mean CSVD scores of VRS (Virchow-Robin spaces)/WML (white matter lesions)/LI (lacunar infarcts)/CMB (cerebral microbleeds) and comparison between the two patient groups [progressive group at initial exam (group1A), progressive group at follow-up (group 1B), stable group at initial exam (group 2A), stable group at follow-up (group 2B)].](/cms/asset/1049d5f8-0b99-4b3e-a2c0-7d7797fd7b4a/irnf_a_1873804_f0004_c.jpg)
Table 6. eGFR value and VRS/LI/WML/CMB comparisons between progressive group and stable group [progressive group at initial exam (group 1A), progressive group at follow-up (group 1B), stabilized group at initial exam (group 2A), stable group at follow-up (group 2B)].
Table 7. Pearson’s Correlation for eGFR with VRS, WML, LI, and CMB.