
Figures & data
Table 1. Outcomes in patients with delta BUN increase versus no increase at 24 h.
Table 2. Odds ratios for death case associated with BUN Increase in whole population and in different subgroups.
Table 3. Analysis by Cox regression of death during hospitalization.
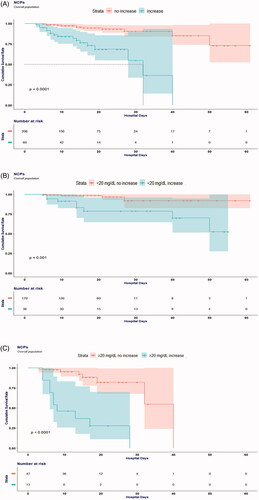
Figure 1. Cumulative incidence for in-hospital death of patients with coronavirus disease 2019 subgrouped by BUN value at admission and BUN change in 24 h. (A) Increase BUN versus no increase BUN at 24 h. (B) Increase BUN versus no increase BUN at 24 h when BUN at admission was normal (<20 mg/dL). (C) Increase BUN versus no increase BUN at 24 h when BUN at admission was abnormal (≥20 mg/dL).
Data availability statement
The data sets supporting the results of this article are included within the article. Some data used during the study are available from the corresponding author by request.