Figures & data
Table 1. Comparison of clinical characteristics between eGFR slope ≧ –3 and < –3 mL/min/1.73m2/yr.
Figure 1. The estimated glomerular filtration rate (eGFR) slopes among (A) LAD < 4.7 cm vs. LAD ≧ 4.7 cm (p = .003); (B) LVM/BSA ≦ 115 g/m2 in male and ≦ 95 g/m2 in female vs. LVM/BSA > 115 g/m2 in male and > 95 g/m2 in female (p < .001); (C) LVM/ht2.7 ≦ 48 g/ht2.7 in male and ≦ 44 g/ht2.7 in female vs. LVM/ht2.7 > 48 g/ht2.7 in male and > 44 g/ht2.7 in female (p < .001); (D) o/p LVM ≦ 128% vs. o/p LVM > 128% (p = .022).
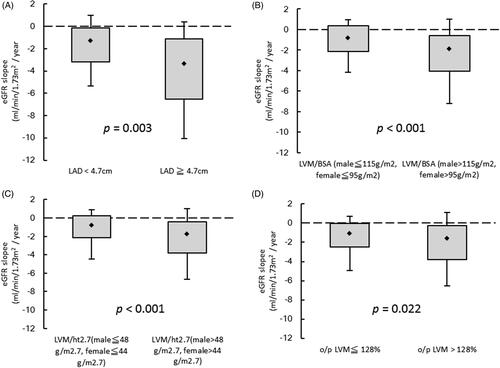
Table 2. Relation of echocardiographic parameters to eGFR slope using linear analysis.
Table 3. Relation of echocardiographic parameters to progression to dialysis using Cox proportional hazards model.
Figure 2. Kaplan-Meier analyses of dialysis-free survival among (A) LAD < 4.7 cm vs. LAD ≧ 4.7 cm (log-rank p = .001); (B) LVM/BSA ≦ 115 g/m2 in male and ≦ 95 g/m2 in female vs. LVM/BSA > 115 g/m2 in male and > 95 g/m2 in female (log-rank p < .001); (C) LVM/ht2.7 ≦ 48 g/ht2.7 in male and ≦ 44 g/ht2.7 in female vs. LVM/ht2.7 > 48 g/ht2.7 in male and > 44 g/ht2.7 in female (log-rank p < .001); (D) o/p LVM ≦ 128% vs. o/p LVM > 128% (log-rank p = .008).
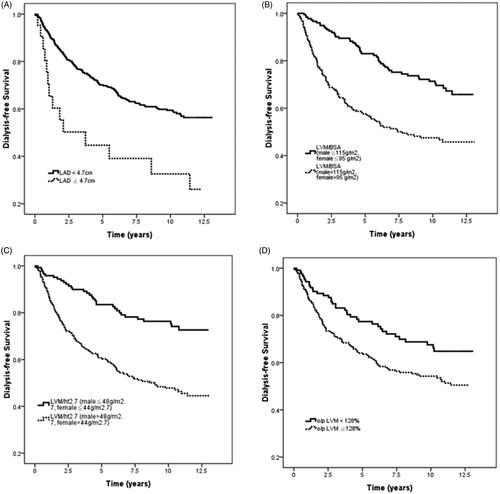
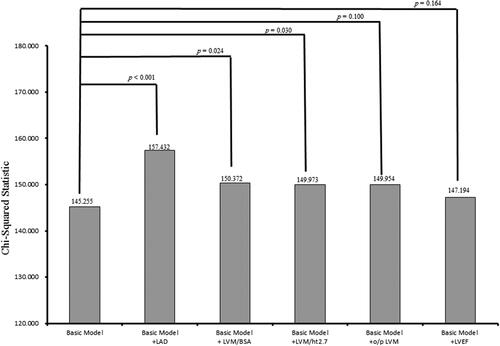
Figure 3. Comparison of the prediction power of addition of echocardiographic parameters to a basic model in the prediction of progression to dialysis. Addition of LAD (p < .001), LVM/BSA (p = .024), and LVM/ht2.7 (p = .030) resulted in a significant improvement in the prediction of progression to dialysis, but o/p LVM (p = .100) and LVEF (p = .164) did not.