Figures & data
Table 1. Clinical characteristics of patients with EHEC-induced HUS.
Figure 1. IGFBP2 production is induced by Stx-2 and LPS in RGECs. Data presented as mean (±standard error of the mean) of four experiments. Stx-2 dose-dependently induced the production of IGFBP2 in RGECs. LPS also induced the production of IGFBP2 in RGECs. Of note, there is no synergistic effect of STx2 on LPS-induced IGFBP2 production. *p<.05, **p<.01, and ***p<.001. LPS: lipopolysaccharide; RGEC: renal glomerular endothelial cell; Stx-2: Shiga toxin 2.
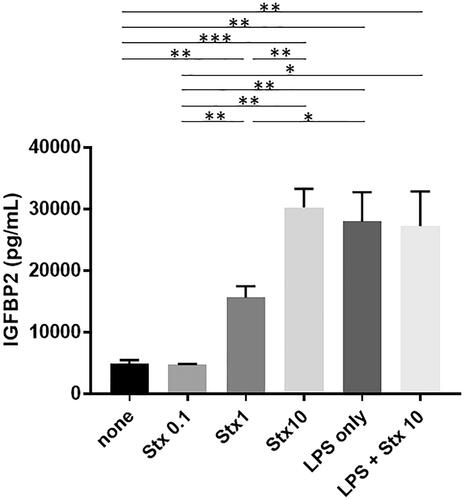
Figure 2. Serum IGFBP2 levels in patients with HUS. Bars represent median values. *p<.05 and ****p<.0001. HCs: healthy controls; IGFBP2: insulin-like growth factor-binding protein 2.
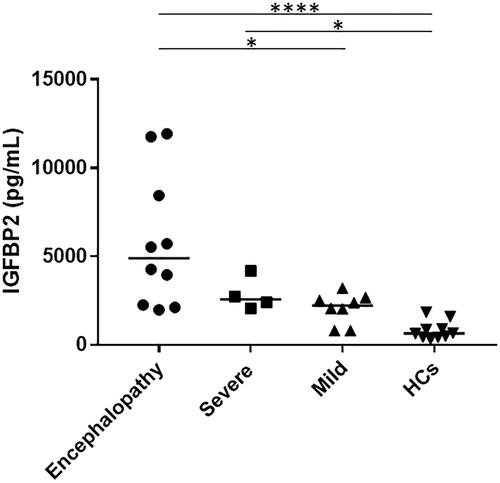
Figure 3. Changes in serum IGFBP2 levels in patients with HUS. Changes in serum IGFBP2 levels from the hemorrhagic colitis phase to the time of HUS diagnosis are shown. Serum IGFBP2 levels in encephalopathy group showed a significant and sharp increase with the progression of HUS, whereas no increase in serum IGFBP2 levels was observed in mild group. *p<.05.
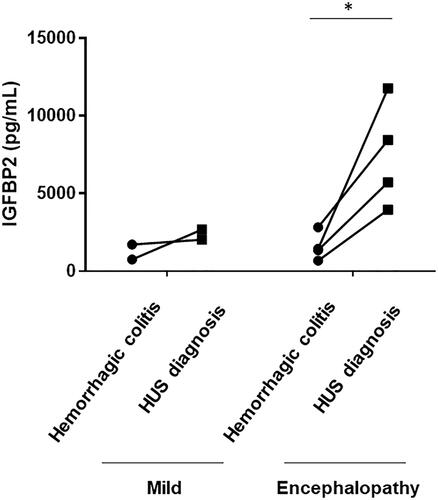
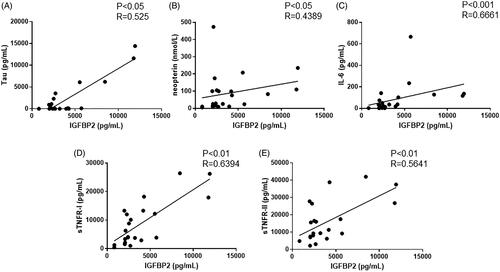
Figure 4. Correlations between serum IGFBP levels and serum tau and cytokine levels in patients with EHEC-HUS. (A) Tau (n = 21), (B) neopterin (n = 22), (C) interleukin 6 (IL-6; n = 22), (D) soluble tumor necrosis factor receptor (sTNFR) I (n = 22), and (E) sTNFR-II (n = 22).