
Figures & data
Figure 1. Flow chart of the patients enrolled in the study.
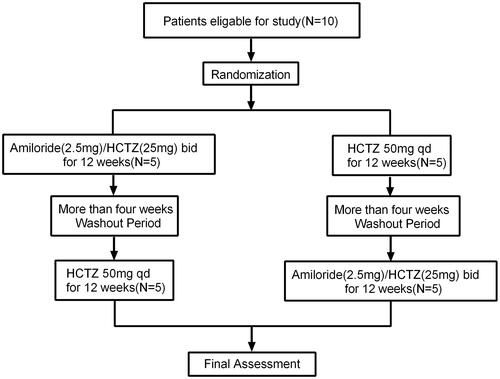
Table 1. Comparison of the baseline characteristics between patients received amiloride/HCTZ and HCTZ before treatment.
Table 2. Comparison of outcomes between amiloride and HCTZ over the course of the study.
Figure 2. (A, B) The correlation between urinary protein/albumin creatinine ratio and urinary suPAR.
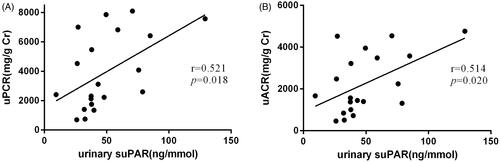
Table 3. Comparison of side effect between amiloride and HCTZ over the course of the study.
Supplemental material
Supplemental Material
Download JPEG Image (334.8 KB)
Data availability statement
The datasets analyzed during the current study are available within the article and Supplementary file.