Figures & data
Table 1. Primer sequences for real-time PCR.
Figure 1. Expression of DDR2 in kidneys of Alport mice. (A,B) Total RNA was isolated from kidney tissues of 8-, 16-, and 24-week-old wild-type (WT) or Alport syndrome mice. Quantitative RT-PCR was performed to evaluate the expression of Ddr2 and Ddr1. The data were normalized to Gapdh. Bars indicate the mean ± S.E. (n = 4–6). ***p<.001 vs WT, assessed by Student’s t test. (C) Immunoblots of protein lysates from whole kidneys of WT and Alport mice were probed with the indicated antibodies. (D) The DDR2 expression was quantified by multi gauge software and normalized with Vinculin (loading control). Bars indicate the mean ± S.E. (n = 3). *p<.05, ***p<.001 vs WT, assessed by Student’s t test.
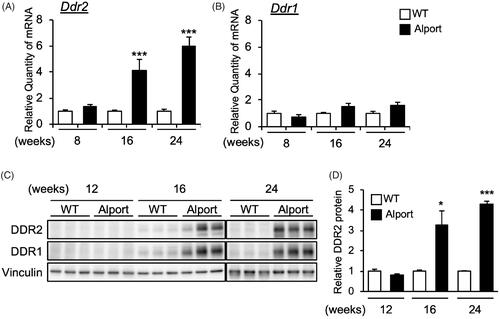
Figure 2. DDR2 ASO inhibits DDR2 expression specifically in Alport mice. (A) Scheme of experimental plan for CON ASO and DDR2 ASO injection. (B,C) Total RNA was isolated from kidney tissues of 24-week-old mice. Quantitative RT-PCR was performed to evaluate the expression of Ddr2 and Ddr1. The data were normalized to Gapdh. Bars indicate the mean ± S.E. (n = 5–6). ***p<.001 vs WT; #p<.05, ###p<.001 vs CON ASO, assessed by Dunnett’s test. n.s., not significant. (D,E) Immunoblotting of protein lysates from whole kidney of WT, CON ASO- and DDR2 ASO-injected mice. (F,G) Blots of DDR2 were quantified by multi gauge software and normalized with Vinculin (loading control). Bars indicate the mean ± S.E. (n = 4). **p<.01 vs WT; ##p<.01 vs CON ASO, assessed by Dunnett’s test.
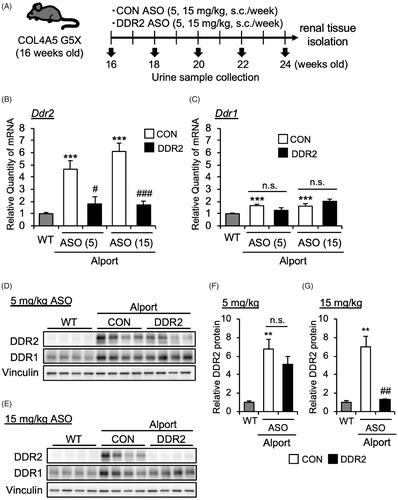
Figure 3. DDR2 ASO did not improve kidney function in Alport mice. (A) Urinary protein and creatinine were measured by Bradford and Jaffe’s method, respectively. Proteinuria score was calculated based on urinary protein and creatinine concentrations. *p<.05, **p<.01 vs WT, assessed by Dunnett’s test. (B) Serum creatinine level, and (C) blood urea nitrogen (BUN) were measured in 24-week-old WT, CON ASO- and DDR2 ASO-treated mice. Bars indicate the mean ± S.E. (n = 5–6). *p<.05, **p<.01 vs WT, assessed by Dunnett’s test. (D,E) Total RNA was isolated from kidney tissues of 24-week-old mice. Quantitative RT-PCR was performed to evaluate the expression of the indicated renal injury markers. The data were normalized to Gapdh. Bars indicate the mean ± S.E. (n = 5–6). **p<.01, ***p<.001 vs WT, assessed by Dunnett’s test. n.s., not significant. (F) Images of PAS-stained renal sections of 24-week-old mice are shown. (G) Glomerulosclerosis score was quantified from PAS-stained sections. (H) PAM staining of renal sections of 24-week-old mice was performed. Lower panels, enlarged view of the area boxed by the red square in upper panel. Red arrows indicate the GBM. Scale bars in F and H, 50 µM.
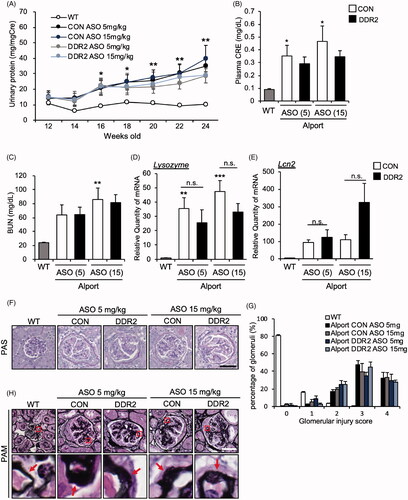
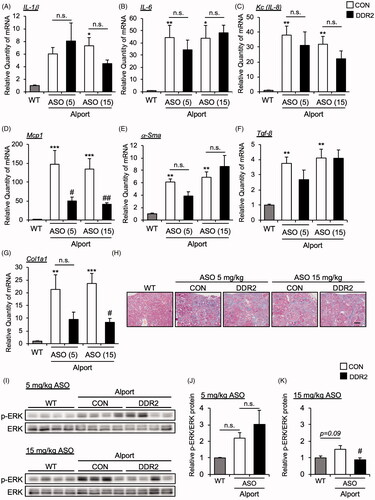
Figure 4. DDR2 ASO did not affect inflammatory and fibrosis gene expression in Alport mice. Total RNA was isolated from kidney tissues of 24-week-old mice. Quantitative RT-PCR was performed to evaluate the expression of the indicated (A-D) cytokines and (E-G) renal fibrosis markers. The data were normalized to Gapdh. Bars indicate the mean ± S.E. (n = 5–6). *p<.05, **p<.01, ***p<.001 vs WT; #p<.05, ##p<.01 vs CON ASO, assessed by Dunnett’s test. (H) Masson-Trichrome staining of renal section of 24-week-old mice was performed. Scale bar, 100 µM. (I) Immunoblots of protein lysates from whole kidneys of WT and AS mice were probed with phosphorylated ERK (p-ERK) or ERK antibodies. (J,K) The p-ERK expression was quantified by multi gauge software and normalized with basal ERK. Bars indicate the mean ± S.E. (n = 4). #p<.05 vs CON ASO, assessed by Dunnett’s test.