Figures & data
Figure 1. NOX4 is mediated at Aldo-induced OS and senescence in HK-2 cells. (A) Western blot analysis showed the expression of NOX4, NOX2, and GAPDH proteins in HK-2 cells after treatment without or with 100nM Aldo for 24 h (n = 3). (B) Equal numbers of HK-2 cells were incubated in media containing buffer (Control), siRNA-Con or siRNA-NOX4 with or without Aldo for 24 h as indicated. The whole cell lysate was immunoblotted with antibodies against NOX4, p21, and GAPDH (n = 3). (C) The graphical presentation showed the relative abundance levels of NOX4 and p21 after normalization with GAPDH (n = 3). (D) Quantification of 2’, 7’-dichlo-rofluorescein (DCF) fluorescence in various groups as indicated (n = 3). (E) SA-β-gal activity, which appears as bright-blue granular staining in the cytoplasm of HK-2 cells in various groups as indicated (n = 3). #p < 0.05 vs. normal control, *p < 0.05 vs. Aldo alone or Aldo + siRNA Con.
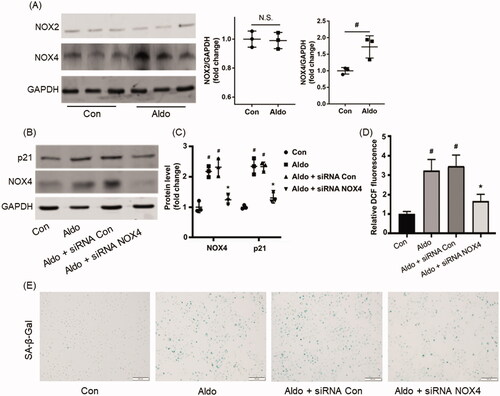
Figure 2. Blocking autophagy worsened Aldo-induced OS and senescence in HK-2 cells. (A) Western blot analysis revealed the expression of LC3-II/LC3-I, p62, and GAPDH proteins in HK-2 cells after various treatments as indicated (n = 3). (B) The graphical presentation indicates the relative abundance levels of LC3-II/LC3-I and p62 after normalization with GAPDH (n = 3). (C) Immunofluorescence staining for LC3 in HK-2 cells, which were incubated in media containing buffer (Control), Aldo, or Aldo + CQ for 24 h as indicated (n = 3). (D) SA-β-gal activity, which appears as a bright-blue granular staining in the cytoplasm of HK-2 cells in various groups as indicated (n = 3). (E) Quantification of 2’, 7’-dichlo-rofluorescein (DCF) fluorescence in various groups as indicated (n = 3). (F) Western blot analysis showed the expression of p21 and GAPDH proteins in HK-2 cells after various treatments as indicated (n = 3). (G) Graphical presentation shows the relative abundance levels of p21 and NOX4 after normalization with GAPDH (n = 3). #p < 0.05 vs. normal control, *p < 0.05 vs. Aldo alone.
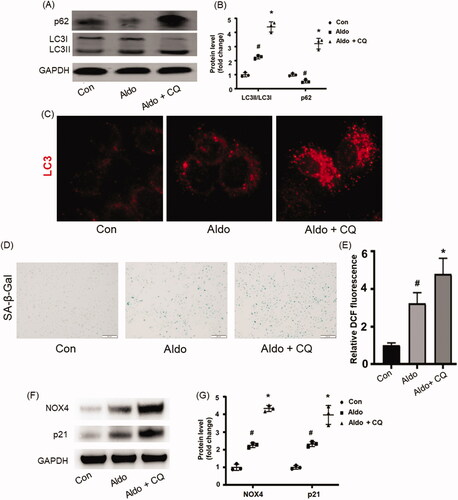
Figure 3. Rap improved Aldo-induced OS and senescence in HK-2 cells. (A) Immunofluorescence staining for LC3 in HK-2 cells, which were incubated in media containing buffer (Control) or Aldo with or without Rap for 24 h as indicated (n = 3). (B) Western blot analysis revealed the expression of LC3-II/LC3-I, p62, and GAPDH proteins in HK-2 cells after various treatments as indicated. (C) Graphical presentation indicated the relative abundance levels of LC3-II/LC3-I and p62 after normalization with GAPDH (n = 3). (D) SA-β-gal activity, which appears as bright-blue granular staining in the cytoplasm of HK-2 cells in various groups as indicated (n = 3). (E) Quantification of 2’, 7’-dichlo-rofluorescein (DCF) fluorescence in various groups as indicated (n = 3). (F) Western blot analysis showed the expression of p21, NOX4, and GAPDH proteins in HK-2 cells after various treatments as indicated (n = 3). (G) Graphical presentation shows the relative abundance levels of p21 and NOX4 after normalization with GAPDH (n = 3). #p < 0.05 vs. normal control, *p < 0.05 vs. Aldo alone.
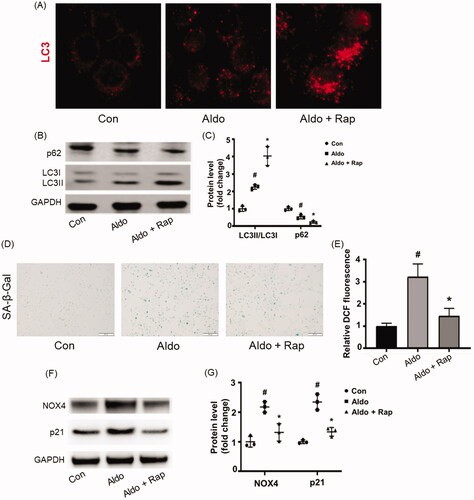
Figure 4. Aldo induced autophagy in kidney proximal tubules in vivo. (A) Western blot analysis revealed the expression of LC3-II/LC3-I, p62, and GAPDH proteins after various treatments in rats, as indicated (n = 3). (B) Graphical presentation showed the relative abundance levels of LC3-II/LC3-I and p62 after normalization with GAPDH (n = 3). (C) Immunohistochemical staining for LC3 in rat kidney tissue from various groups, as indicated (n = 6). (D) Representative electron micrographs showing autophagic vacuoles in PTCs (n = 6). The red arrow indicates autophagosomes. Scale bar = 2 μm. (E) Bar graph indicating the Autophagosomes/ENP in various groups (n = 6). #p < 0.05 vs. normal control, *p < 0.05 vs. Aldo alone.
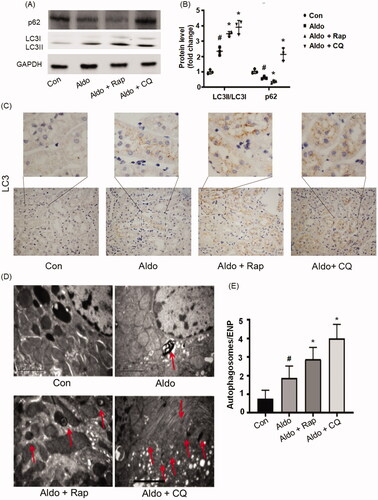
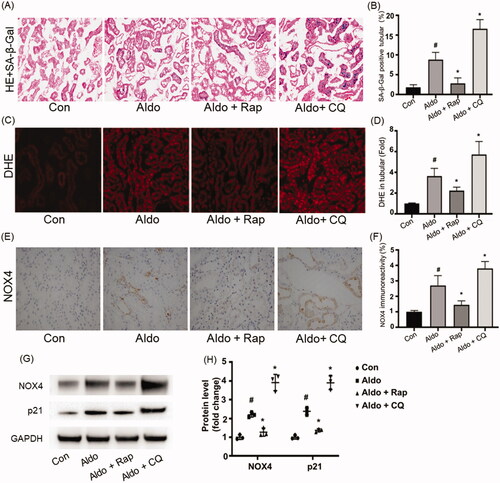
Figure 5. Autophagy regulated OS and senescence in PTCs of Aldo-induced rats. (A) Senescence-associated-galactosidase (SA-β-Gal) Staining in rat renal cortex (n = 6). SA-β-Gal is labeled by bright-blue in the PTCs. (B) Bar graph indicating the percentage of SA-β-Gal positive cells per field in tubular. (C) DHE staining of rat kidney sections (n = 6). (D) Bar graph indicating the mean DHE intensity per field in rat tubular cells. (E) Immunohistochemical staining for NOX4 in rat kidney tissues from various groups, as indicated (n = 6). (F) Bar graph indicating NOX4 immunoreactivity per field in rat tubular cells. (G) Western blot analysis revealed the expression of NOX4, p21, and GAPDH proteins after various treatments in rats (n = 3). (H) Graphical presentation shows the relative abundance levels of NOX4 and p21 after normalization with GAPDH (n = 3). #p < 0.05 vs. normal control, *p < 0.05 vs. Aldo alone.