Figures & data
Figure 1. Poly IC induces the expression of MCP-1 and CCL5 in cultured human GECs in a concentration-dependent manner. The cells were treated with various concentrations of poly IC. After 24 h incubation, RNA was extracted and subjected to real-time RT-PCR (a,c). The concentrations of MCP-1 and CCL5 in the medium were analyzed using ELISA (b,d). Data are shown as the means ± SD (n = 3, *p < 0.01, by t-test).
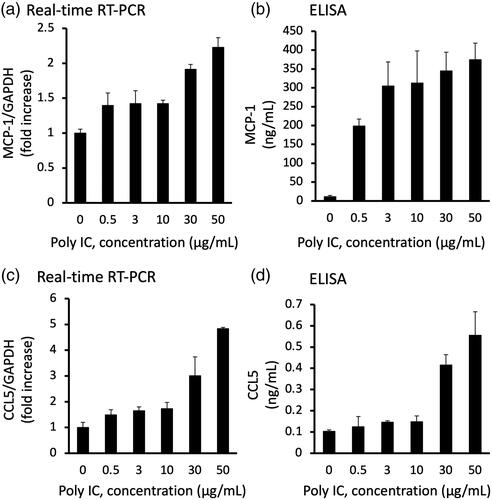
Figure 2. Poly IC induces the expression of MCP-1 and CCL5 in cultured human GECs in a time-dependent manner. The cells were treated with 30 μg/mL poly IC for up to 24 h. The conditioned medium was collected, and RNA was extracted from the cells. Real-time RT-PCR (a,c,e) and ELISA (b,d) analyses were performed. Data are shown as the means ± SD (n = 3, *p < 0.01, by t-test).
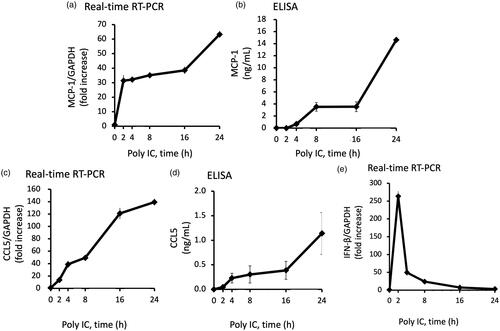
Figure 3. Knockdown of IFN-β decreases the poly IC-induced expression of both MCP-1 and CCL5, and knockdown of p65 decreases the poly IC-induced all of IFN-β, CCL5 and MCP-1 in cultured human GECs. The cells were transfected with siRNA against IFN-β, p65 or a non-silencing negative control siRNA. After 24h incubation, the cells were treated with 30 μg/mL poly IC for an additional 24 h (a–d, f, and g) or 2 h (e). The medium was collected, and RNA was extracted from cells, after which quantitative real-time RT-PCR analysis was performed. Data are shown as the means ± SD (n = 3, *p < 0.01 by t-test).
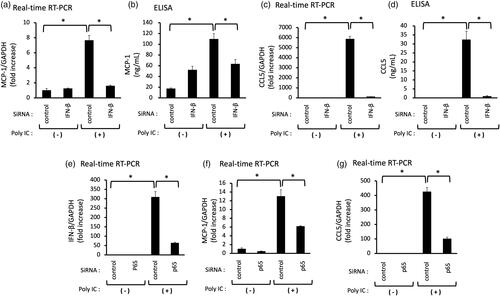
Figure 4. (a–d) Pretreatment with CQ inhibits the expression of both MCP-1 and CCL5 induced by poly IC. The cultured GECs were pretreated with 1 or 10 μg/mL CQ for 1 h and subsequently treated with 30 μg/mL poly IC for 16 h. The medium was collected, and RNA was extracted from cells, after which quantitative real-time RT-PCR and ELISA analyses were performed. Data are shown as the means ± SD (n = 3, *p < 0.01, by t-test).
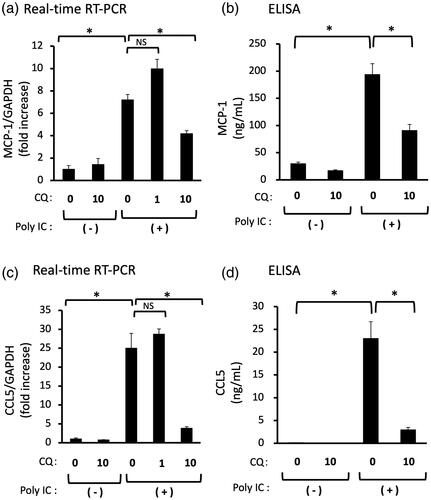
Figure 5. Pretreatment of GECs with HCQ inhibits the expression of CCL5, but not of MCP-1 and IFN-β. The cultured GECs were pretreated with 1 or 10 μg/mL HCQ for 1h and subsequently treated with 30 μg/mL poly IC for 16h. The medium was collected, and RNA was extracted from cells, after which quantitative real-time RT-PCR (a,c,e) and ELISA (b,d) analyses were performed. Data are shown as the means ± SD (n = 3, *p < 0.01, by t-test). (f) The cells were pretreated with 10 μg/mL HCQ for 1h, and then treated with 30 μg/mL poly IC for 6h. The cells were lysed and western blotting for phosphorylated STAT1 (p-STAT1) and STAT1 was performed.
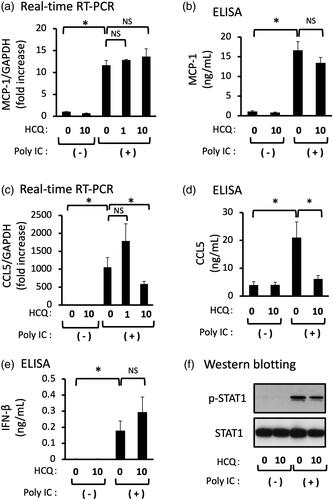
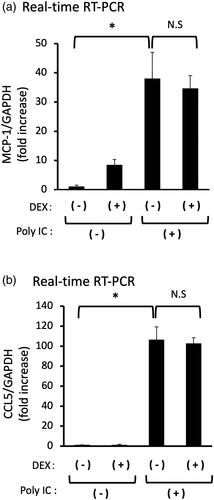
Figure 6. (a,b) Pretreatment of DEX does not inhibit the expression of both MCP-1 and CCL5 induced by poly IC. The cultured GECs were pretreatment with 10 μM DEX for 1h and subsequently treated with 30 μg/mL poly IC for 16h. The medium was collected, and RNA was extracted from cells, after which quantitative real-time RT-PCR analysis was performed. Data are shown as the means ± SD (n = 3, *p < 0.01, by t-test).