
Figures & data
Figure 1. Patient inclusion and exclusion criteria.
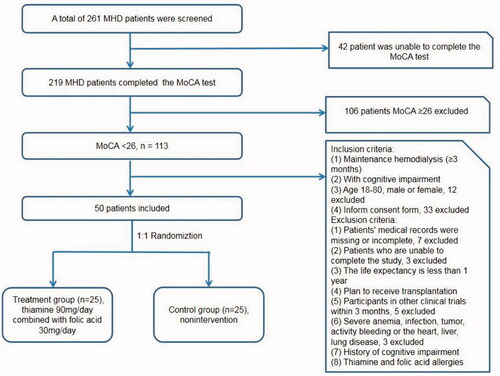
Table 1. Comparison of baseline data between the treatment group and the control group.
Table 2. Comparison of MoCA scores, serum thiamin, folic acid and homocysteine in the control and treatment group at baseline, 48 weeks and 96 weeks of follow-up.
Figure 2. The Kaplan–Meier patient survival analysis between the treatment group and the control group (p = 0.048).
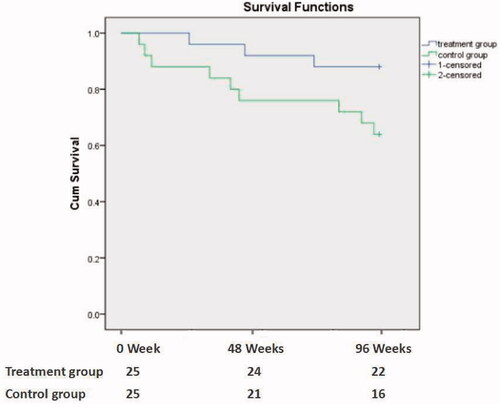
Table 3. Comparison of major causes of death between treatment group and control group.
Supplemental material
Supplemental Material
Download PDF (152.7 KB)Supplemental Material
Download PDF (131.8 KB)Supplemental Material
Download PDF (99.7 KB)Supplemental Material
Download PDF (136 KB)Supplemental Material
Download PDF (138.7 KB)Data availability statement
The data analyzed in the current study are available from the corresponding author on reasonable request. Raw data retained at the Clinical Center for Investigation, Renji Hospital (RJDBLK2020-03-N13001).