Figures & data
Figure 1. Droplet and copy numbers for miRNA 21 and miRNA 155. miRNA quantitation was performed under optimized ddPCR conditions using the Taqman assay. The results were presented as copy numbers per microliter. Samples with at least 10,000 droplets were included in the study. miRNA quantitation was calculated by separating negative (black) and positive (blue) droplets using a Poisson 95% confidence interval.
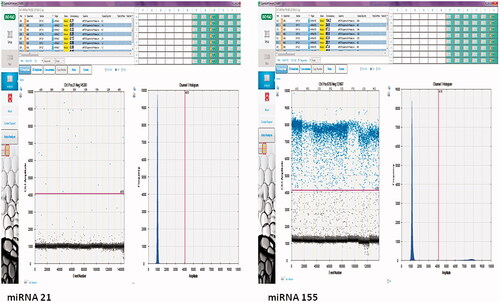
Table 1. A comparison of demographic and biochemical parameters in the hypertension, resistant hypertension and control groups.
Figure 2. A comparison of miRNA 21 levels in the hypertension, resistant hypertension and control groups. miRNA 21 levels were significantly higher in the Resistant Hypertension group than in the other two groups (p < 0.001).
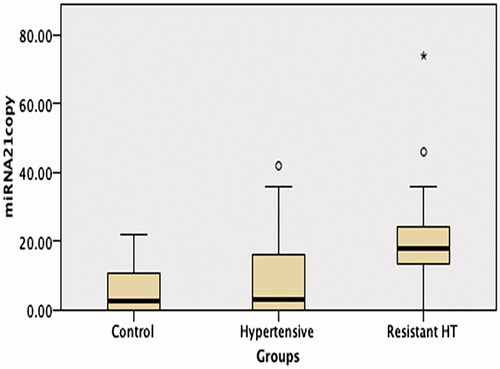
Figure 3. A comparison of miRNA 155 levels in the hypertension, resistant hypertension and control groups. No difference was observed between the resistant hypertension, hypertension and control group miRNA 155 levels.
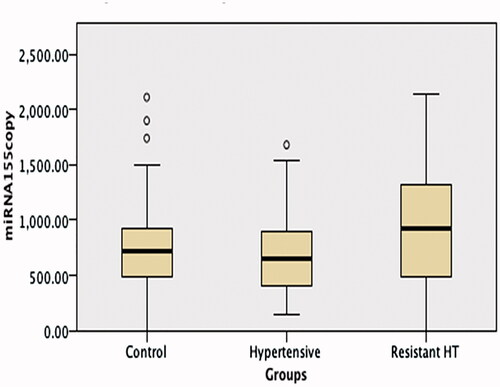
Figure 4. Correlation analysis of miRNA 21 and aldosterone. Positive correlation was determined between miRNA 21 and aldosterone in the patient group (r = 0.339, p = 0.002)
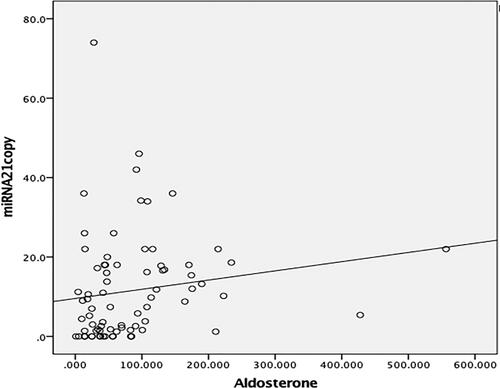
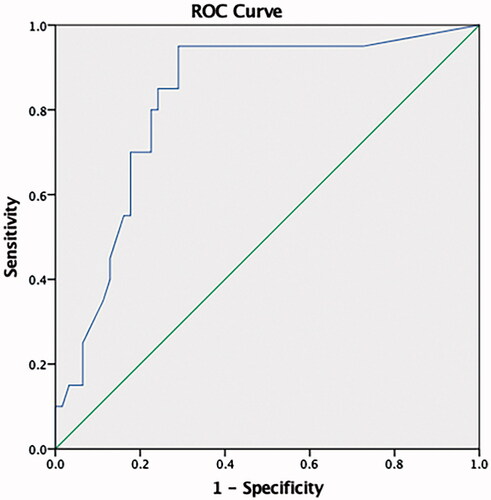
Figure 5. ROC curve analysis. MiRNA 21 was found to predict RH with 95 sensitivity and 71% specificity at a 9.6 copy/uL level (AUC: 0.823, 95% CI (0.72–0.92).