Figures & data
Table 1. Sequences of the primers for quantitative real-time PCR.
Figure 1. FG-4592 attenuated I/R-induced AKI. (A) Schematic diagram of the experimental design. In brief, mice were administrated with FG-4592 or vehicle before performing ischemia/reperfusion injury. And the mice were sacrificed at 48 h after disease induction. (B) Serum creatinine and BUN levels. (C) Representative images of PAS staining of kidneys (×400). (D) Tubular injury score in mice. (E) Western blot analysis of KIM-1 in renal cortex tissue lysates. n = 6 mice per group. Data are presented as mean ± SD, **p < .01 vs. I/RI + NC mice, #p < .05 vs. sham mice, ANOVA followed by Bonferroni correction.
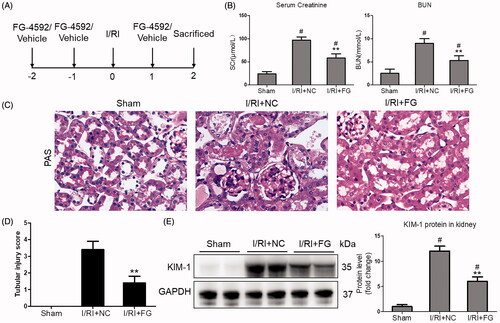
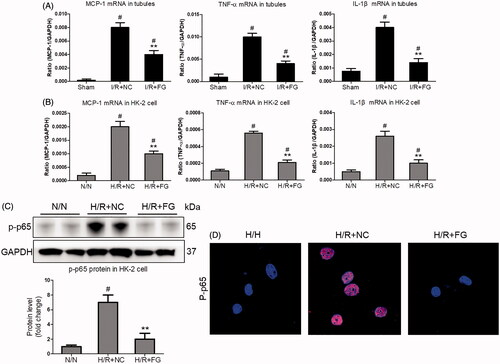
Figure 2. Effects of FG-4592 on renal inflammation in mice challenged with I/R-induced injury. (A) qRT-PCR analysis of cytokine (TNF-α, IL-1β and CCL-2) mRNA expression levels in renal cortex tissue lysates. (B, C) Immunostaining of F4/80 and neutrophils in the kidneys (×200). (D) Western blot analysis of p-p65 in renal cortex tissue lysates of mice (left) and quantitative analysis of the Western blots of p-p65 (right). n = 6 mice per group. Data are presented as mean ± SD, **p < .01 vs. I/RI + NC mice, #p < .05 vs. sham mice, ANOVA followed by Bonferroni correction.
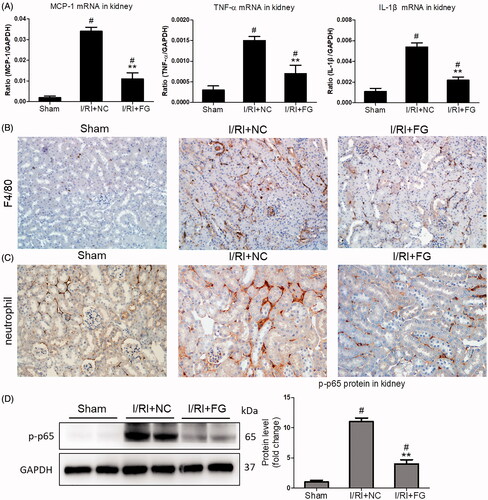
Figure 3. FG-4592 protected against hypoxia-induced HK-2 cells injury. (A) Schematic diagram of the experimental design. In brief, the HK-2 cells were administrated with FG-4592 or vehicle before performing hypoxia/reoxygenation. And the cells were harvested at 6 h after reoxygenation. (B) Representative images of HK-2 cells (×200); (C) qRT-PCR analyses of KIM-1 mRNA expression in HK-2 cells. GAPDH was used as an internal control. (D) Western blotting analysis of KIM-1 protein in HK-2 cells. Quantitative analysis of the Western blots of KIM-1. (E) Western blot analysis of Bax and Cleaved-caspase-3 in HK-2 cells. Quantitative analysis of the Western blots of Bax and C-caspase-3. HK-2 were pretreated with or without FG-4592, then cultured with H/R. GAPDH was used as the loading control. Data were expressed as means ± SD. All experiments were duplicated for three time. **p < .01 vs. H/R + NC group, #p < .05 vs. N/N group, ANOVA followed by Bonferroni correction. qRT-PCR: quantitative real-time PCR.
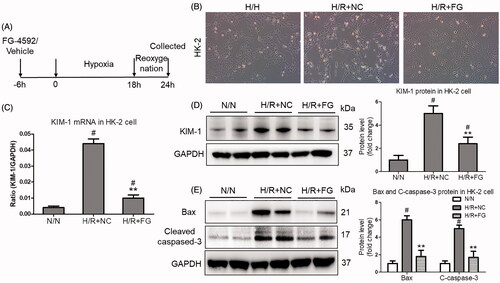
Figure 4. The inflammation was suppressed by FG-4592 in hypoxia-induced TECs. (A) qRT-PCR analysis of cytokine (TNF-α, IL-1β and CCL-2) mRNA expression levels in TECs lysates (n = 6). (B) qRT-PCR analysis of cytokine (TNF-α, IL-1β and CCL-2) mRNA expression levels in HK-2 cells. (C) Western blotting analysis of p-p65 protein in HK-2 cells. Quantitative analysis of the Western blots of p-p65. GAPDH was used as the loading control. (D) Representative immunofluorescence staining of p-p65 (×1000). HK-2 were pretreated with or without FG-4592, then cultured with H/R. GAPDH was used as the loading control. All experiments were duplicated three times. **p < .01 vs. I/RI + NC or H/R + NC group, #p < .05 vs. I/RI + NC or N/N group, ANOVA followed by Bonferroni correction.