
Figures & data
Figure 1. Flowchart of study participants for the cross-sectional study. AAC indicates abdominal aortic calcification.
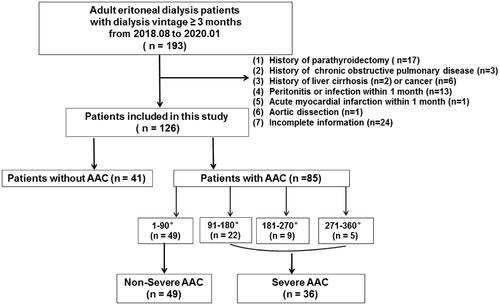
Figure 2. Cross-sectional view of abdominal aortic calcification by CT in four representative cases.
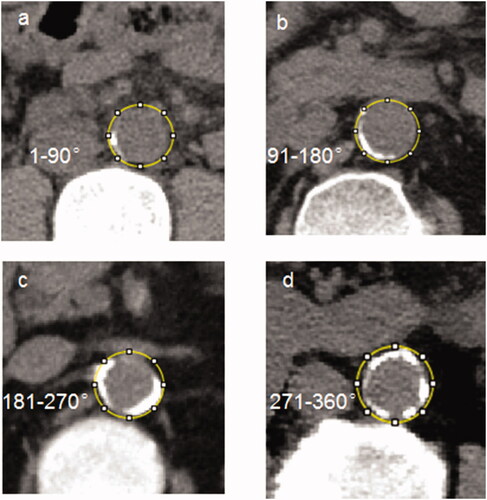
Table 1. Comparisons of demographic data and laboratory parameters among PD patients with or without AAC and the controls.
Figure 3. Correlation analyses of EDPs with other parameters in PD patients. *p < 0.05, **p < 0.01, ***p < 0.001
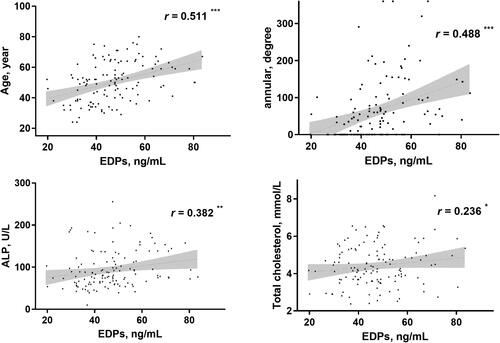
Figure 4. Comparisons of EDPs among different groups presented as a dot-plot. EDPs of PD patients with or without AAC were greatly higher than healthy controls. In all PD patients, EDPs of AAC were significantly higher than those without AAC. In patients with severer AAC, EDPs were also higher than those without severer AAC. AAC indicates abdominal aortic calcification; PD: peritoneal dialysis; EDPs, elastin-derived peptides.
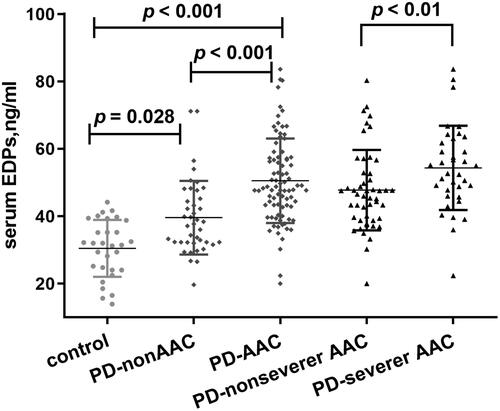
Figure 5. Receiver operating characteristic curves to predict AAC in PD patients. A combined model of age, PD vintage, UA, and EDPs yielded a significant increase in AUC when compared with other factors alone (Union factor 1, AUC = 0.903). The respective AUC of other parameters including EDPs, PD vintage, age, and UA was 0.766, 0.721), 0.813), and 0.645.
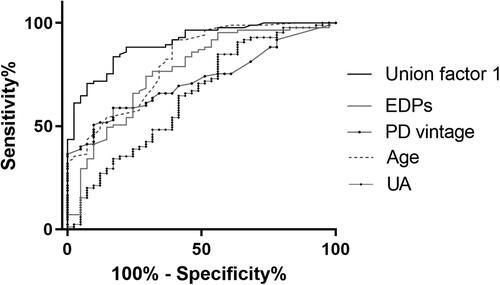
Table 2. Univariate and multivariate logistic regression analysis for effects of EDPs on AAC in PD patients.
Table 3. Comparisons of demographic data and laboratory parameters with or without severer AAC in PD patients.
Figure 6. Receiver operating characteristic curves to predict severe AAC in PD patients. A combined model of age, PD vintage, P, and EDPs yielded a significant increase in AUC when compared with other factors alone (Union factor 2, AUC = 0.886). The respective AUC of other parameters including EDPs, PD vintage, age, and P was 0.681, 0.856, 0.715, and 0.633.
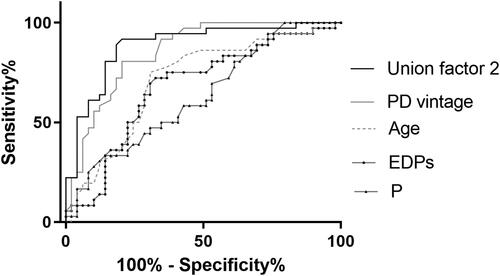
Table 4. Logistic regression analysis of EDPs on severer AAC in PD patients.
Supplemental Material
Download PDF (634.2 KB)Data availability statement
The data that support the findings of this study are openly available in figshare at http://doi.org/10.6084/m9.figshare.13172660.