Figures & data
Figure 1. Fut8 expression was upregulated in the peritoneum of peritoneal fibrosis (PF) rats. PF rat model was established by daily intraperitoneal injection of standard peritoneal dialysis fluid for 6 weeks. (a and b) Representative Western blot images and analyses of Fut8 in normal saline (NS) and peritoneal fibrosis (PF) rats. Results are expressed as mean ± SEM of eight rats per group. **p < 0.01 vs. NS group.
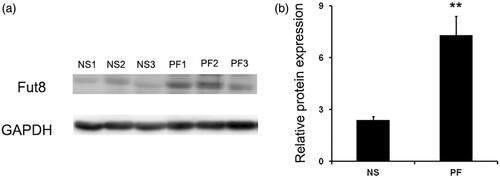
Figure 2. Fut8shRNA effectively inhibited Fut8 expression, and EGF receptor is modified by core fucosylation: (a) representative Western blot images and analyses of Fut8 in the normal saline (NS), peritoneal fibrosis (PF), adenovirus-control (Ad-con), and adenovirus-Fut8 (Ad-Fut8) groups; (b) representative Western and lectin blot analysis and quantification of the core fucose levels of the EGF receptor in the four groups. EGF receptor was immunoprecipitated from tissue lysates and then subjected to electrophoresis. After electroblotting, blots were probed by Lens culinaris agglutinin (LCA)–Biotin. Results are expressed as mean ± SEM of eight rats per group. *p < 0.05, **p < 0.01 vs. NS group. #p < 0.05 each group (except for NS group) vs. both PF and Ad-con group.
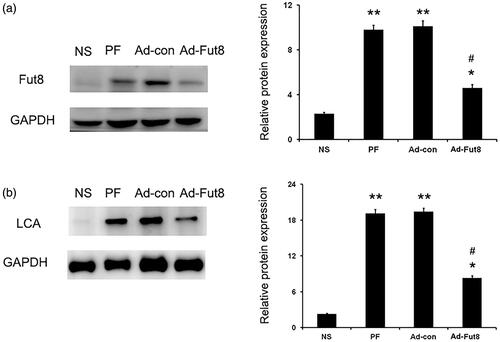
Figure 3. EGF and EGF receptor (EGFR) were upregulated by glucose PD dialysate. Representative Western blot images and analyses of EGF (a) and EGFR (b) in the normal saline (NS), peritoneal fibrosis (PF), adenovirus-control (Ad-con), and adenovirus-Fut8 (Ad-Fut8) groups. The expression of EGF and EGFR were not affected by Fut8shRNA presence. **p < 0.01 vs. NS group.
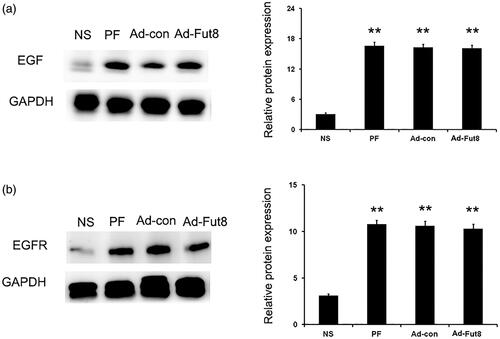
Figure 4. Fut8shRNA alleviated peritoneal structural and functional alteration and collagen I accumulation in rats with peritoneal fibrosis: (a) representative photographs of Masson’s staining (bar = 100 μm); (b) representative photographs of collagen I accumulation in peritoneal membrane (immunohischemistry, bar = 100 μm); (c) analysis of peritoneal thickness and ultrafiltration volume; (d) analysis of positive stained-area (%) of collagen I accumulation in peritoneal membrane; for quantitative assessment, an average of 5 independent measurements of positive stained - area (%) was calculated for each section using Image-Pro Plus 6.0 software; (e) analysis of MCP-1 in peritoneal effluent. Results are expressed as mean ± SEM of eight rats per group. *p < 0.05, **p < 0.01 vs. NS group. #p < 0.05 each group (except for NS group) vs. both PF and Ad-con group.
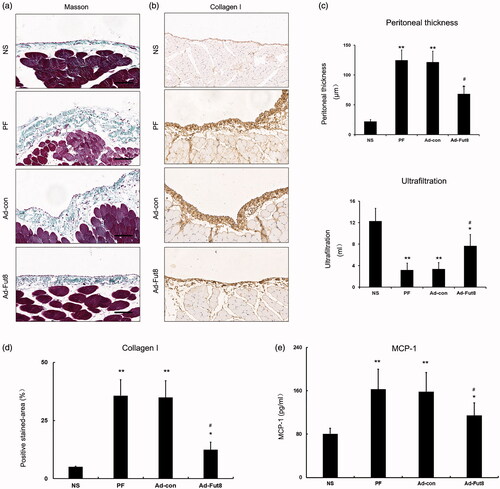
Figure 5. Fut8shRNA abolished activation of EGF signaling pathway. Representative western blot images and analyses of STAT3/p and STAT3, and NF -κB/p and NF-κB. *p < 0.05, **p < 0.01 vs. NS group. #p < 0.05, ##p < 0.01 each group (except for NS group) vs. both PF and Ad-con group.
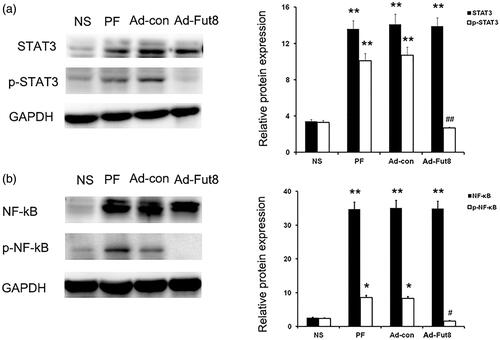
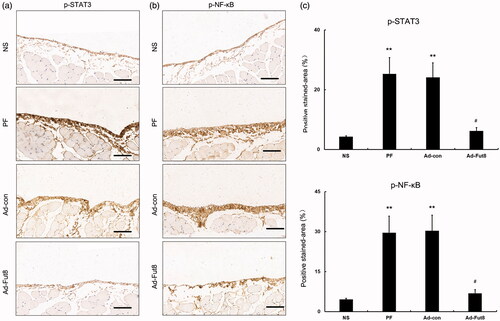
Figure 6. Fut8shRNA treatment reduced the expression of phosphorylation of STAT3 (p-STAT3) and NF-κB (p-NF-κB). **p < 0.01 vs. NS group. #p < 0.05 each group (except for NS group) vs. both PF and Ad-con group. Bar = 100 μm.