
Figures & data
Table 1. Comparison of excluded/included clinical and demographic characteristics of the patients.
Table 2. Correlation between NT-proBNP and hydration ratios pre and post-dialysis.
Table 3. Biomarker levels and ECW/TBW ratio cutoff for global and cardiovascular mortality.
Table 4. Demographic and clinical characteristics of the 60 patients included in the study, survivors and non survivors.
Table 5. Relationship between hydration parameters measured by bioimpedance in survivors and non survivors.
Figure 1. ROC curve for ECW/TBW using death as event.
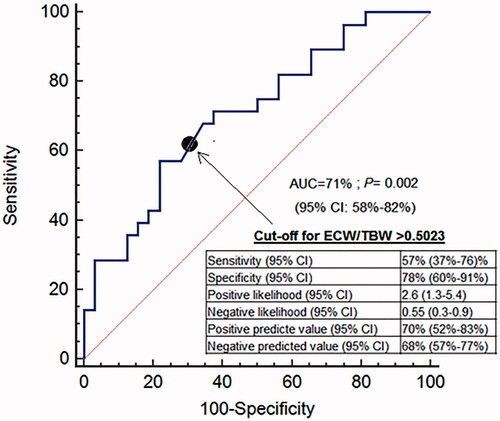
Figure 2. Kaplan–Meier survival curves using the cutoff ECW/TBW >0.5023. as predictor and death as outcome.
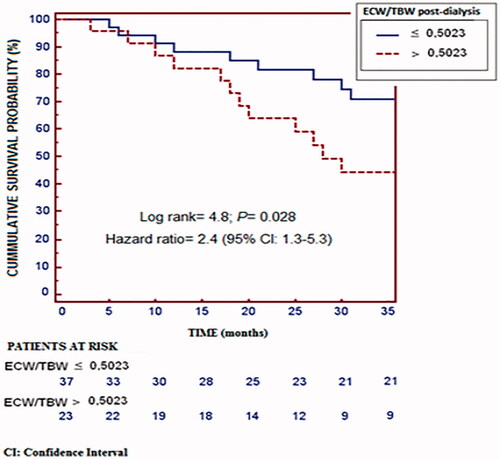
Figure 3. ROC curve for ECW/TBW using cardiovascular death as event.
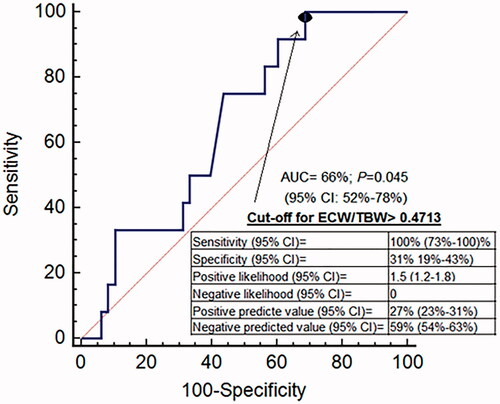
Figure 4. Kaplan–Meier survival curves using the cutoff ECW/TBW >0.4713 as predictor and death as outcome.
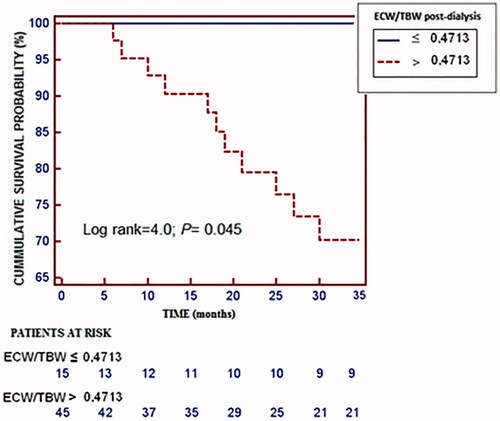
Table 6. Partial Cox regression models to predict global mortality using an ECW/TBW post-dialysis cutoff value higher than 0.5023 as the main independent variable.
Data availability statement
Materials described in the manuscript, including all relevant raw data, will be freely available to any scientist wishing to use them for noncommercial purposes, without breaching participant confidentiality.