
Figures & data
Table 1. Demographics, clinical characteristics and laboratory results in controls and stage 5 CKD patients.
Figure 1. Baseline HRV indices in CKD5 patients and healthy controls. CKD5 patients were divided into 6 groups according to plasma iPTH levels: 1: iPTH ≤ 50pg/mL (n = 30); 2: 50 < iPTH ≤ 150pg/mL (n = 53); 3: 150 < iPTH ≤ 300pg/mL (n = 41); 4: 300 < iPTH ≤ 800pg/mL (n = 37); 5: 800 < iPTH ≤ 1500pg/mL (n = 80); 6: iPTH >1500pg/mL (n = 113). MHR: mean 24-h heart rate; Mean NN: mean normal-to-normal R-R intervals; SDNN: standard deviation of the normal-to-normal R-R intervals; SDANN: standard deviation of 5-min average of normal R-R intervals; rMSSD: root-mean square of differences between adjacent normal R-R interval; pNN50: percentage of adjacent NN intervals differing by more than 50 milliseconds; VLF: very-low frequency; LF: low-frequency; HF: high-frequency.
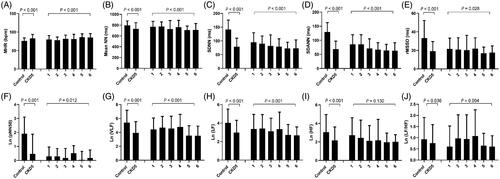
Table 2. Influencing factors of HRV in CKD5 patients analyzed by multiple stepwise regression.
Figure 2. Comparisons of laboratory indices in PTX patients. PTX: parathyroidectomy; Hb: hemoglobin; Alb: albumin; Ca: calcium; P: phosphorus; ALP: alkaline phosphatase; iPTH: intact parathyroid hormone.
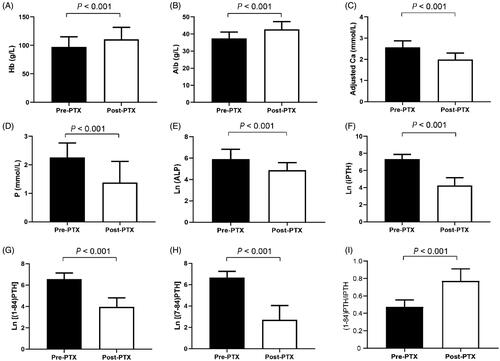
Table 3. Pre- and post-PTX HRV indices in CKD5 patients.
Figure 3. Correlations between the changes of plasma PTH fragments levels and HRV indices in PTX patients before and after operation. Linear correlations between SDNN and Ln (iPTH) (A), Ln[(1-84) PTH] (B) and Ln [(7-84) PTH] (C) in post-PTX patients. Linear correlation between SDANN and Ln[(1-84) PTH] (D) in post-PTX patients (p = .042). PTX: parathyroidectomy; iPTH: intact parathyroid hormone. Δ: subtracting the values before PTX from the values of post-PTX; |Δ|: absolute value.
![Figure 3. Correlations between the changes of plasma PTH fragments levels and HRV indices in PTX patients before and after operation. Linear correlations between SDNN and Ln (iPTH) (A), Ln[(1-84) PTH] (B) and Ln [(7-84) PTH] (C) in post-PTX patients. Linear correlation between SDANN and Ln[(1-84) PTH] (D) in post-PTX patients (p = .042). PTX: parathyroidectomy; iPTH: intact parathyroid hormone. Δ: subtracting the values before PTX from the values of post-PTX; |Δ|: absolute value.](/cms/asset/96a3cf85-45a0-4ae1-9b3a-f1e9d1a437d8/irnf_a_1931318_f0003_c.jpg)