
Figures & data
Figure 1. Treatment timeline, Alpha diversity, Beta diversity, and 24-h urinary protein of patient A before, during, and post FMT. (A) Treatment timeline of patient A. The timeline shows the major clinical events during the treatment process of patient A. M: month; FK506: tacrolimus; MMF: mycophenolate mofetil; FMT: fecal microbiota transplantation. (B) Alpha diversity (Chao index), which refers to the diversity within a particular region or ecosystem and is a comprehensive indicator of richness and evenness of gut microbiota in patient A. Black dots represent different samples collected from patient A before (A_Pre), during (A_FMT), and post FMT (A_Post). (C) Beta diversity (PCOA index), which reflects the significant microbial community difference between gut microbiota of samples from patient A. Red dots represent samples from donors; Samples collected from patient A before (A_Pre, blue square), during (A_FMT, green triangle), and post FMT (A_Post, yellow diamond). (D) 24-h urinary protein of patient A before, during, and post FMT. Red solid line indicates the trend.
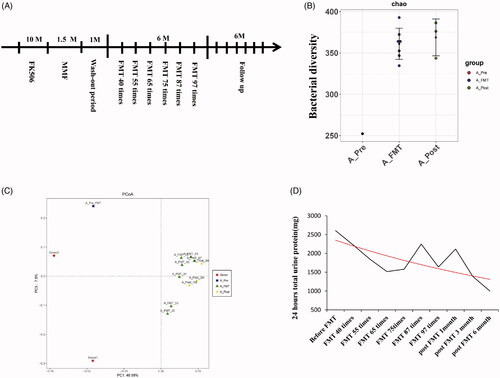
Table 1. Clinical parameters of patient A and B before, during, and post FMT.
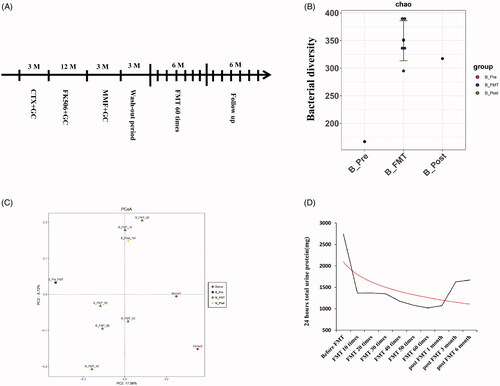
Figure 2. Treatment timeline, Alpha diversity, Beta diversity, and 24-h urinary protein of patient B before, during, and post FMT. (A) Treatment timeline of patient B. The timeline shows the major clinical events during the treatment process of patient B. M: month; CTX: cyclophosphamide; FK506: tacrolimus; MMF: mycophenolatemofetil; FMT: fecal microbiota transplantation. (B) Alpha diversity (Chao index) of gut microbiota in patient B. Black dots represent different samples collected from patient B before (B_Pre), during (B_FMT), and post FMT (B_Post). (C) Beta diversity (PCOA index) of gut microbiota in patient B. Red dots represent samples from donors; Samples collected from patient B before (B_Pre, blue square), during (B_FMT, green triangle), and post FMT (B_Post, yellow diamond). (D) 24-h urinary protein of patient B before, during, and post FMT. A Red solid line indicates the trend.
Supplemental Material
Download PDF (513 KB)Supplemental Material
Download PDF (328.2 KB)Supplemental Material
Download PDF (508.6 KB)Supplemental Material
Download PDF (187.8 KB)Supplemental Material
Download PDF (184.2 KB)Supplemental Material
Download PDF (185.8 KB)Supplemental Material
Download PDF (190.7 KB)Supplemental Material
Download PDF (187.6 KB)Supplemental Material
Download TIFF Image (10.9 MB)Supplemental Material
Download TIFF Image (13.7 MB)Supplemental Material
Download TIFF Image (18.8 MB)Data availability statement
The sequencing data of our manuscript has been deposited in data repository, National Center of Biotechnology Information (NCBI) (NO.PRJNA630819).