Figures & data
Figure 1. Serum from DN mice induced podocyte injury and endoplasmic reticulum stress. (A) MCP5 podocytes were treated either with 10% serum from control C57BL/KsJ dm/m mice or with 10% serum from C57BL/KsJ dm/dm DN mice for 24 h. Western blot image showing activation of PERK-eIF2α-ATF4 in ER stress signaling pathway and increased apoptosis-related molecule cleaved caspase-3 in podocytes treated with serum from DN mice as compared to control mice. (B) Densitometric quantification of protein expression from Figure 1(A). (**p < 0.01, *p < 0.05).
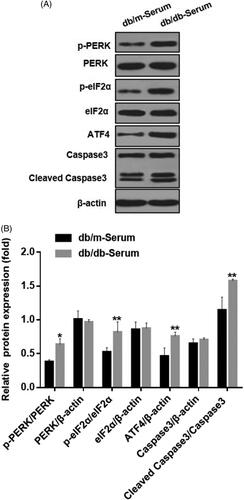
Figure 2. Effects of ATF4 knockdown on podocyte apoptosis when exposed to serum from DN mice in-vitro. (A) Comparison of knockdown efficiency of various ATF4 siRNA constructs and the most efficient ATF4 siRNA-3 was selected for the present study. (B) Western blot analysis showed that cleaved caspase-3 protein expression was markedly increased by ATF4 siRNA in MCP-5 cells. (C) Densitometric analysis of caspase-3 protein expression from Figure 2(B). (D) Podocyte apoptosis determined by flow cytometry showed significant increase in cell death by ATF4 siRNA treatment. (E) Quantification of apoptosis rates from Figure 2(D). siRNA-NC: Negative control siRNA. (**p < 0.01, *p < 0.05).
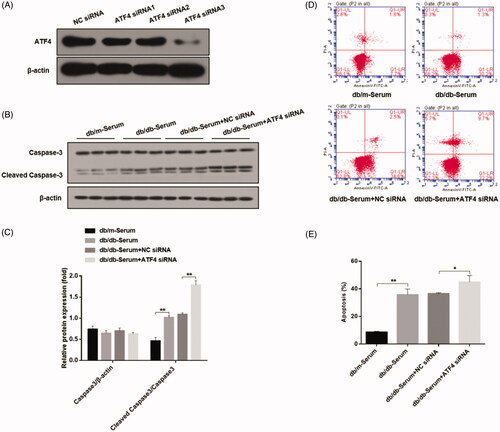
Figure 3. Effects of ATF4 knockdown and mTOR inhibitor rapamycin on autophagy and apoptosis in podocytes induced by serum from DN mice. (A) Immunofluorescence analysis of expression and distribution of autophagy markers protein LC3 showed significant downregulation by ATF4 siRNA in MCP-5 podocytes exposed to serum from DN mice, which was reversed by rapamycin treatment; scale indicates 10 μm. (B) Protein expression analysis supported our immunofluorescence data on LC3 downregulation by ATF4 siRNA and rescue by rapamycin. It further showed that rapamycin treatment significantly reduced cleaved caspase-3 expression. (C) Densitometric analysis of protein expression from Figure 3(B). (D) Densitometric analysis of protein expression. (E) Podocyte apoptosis was evaluated by flow cytometry. (F) Quantification of apoptosis rates. siRNA-NC: control siRNA transfected for 48 h; siRNA-ATF4: siRNA-ATF4 transfected for 48 h. RAP, Rapamycin treatment for 24 h. (**p < 0.01, *p < 0.05).
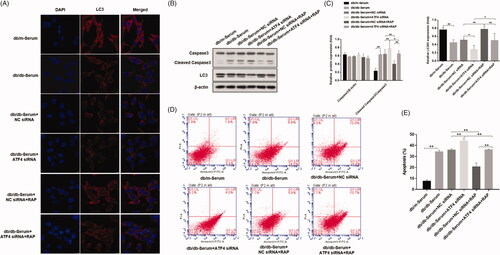
Figure 4. Effects of ATF4 knockdown on HO-1 expression on podocytes exposed to serum from DN mice. (A) Protein expression analysis revealed that HO-1 expression was increased by serum from DN mice, indicating increased ER stress, while ATF4 siRNA significantly reduced HO-1 expression in MCP-5 podocyte. (B) Densitometric analysis of protein expression from Figure 4(A) (**p < 0.01, *p < 0.05).
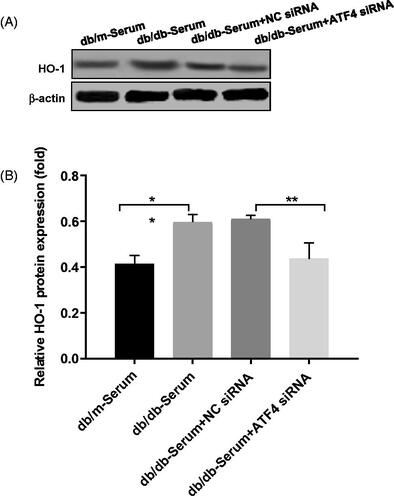
Figure 5. Effects of ATF4 knockdown and HO-1 overexpression on podocyte autophagy and apoptosis when subjected to serum from DN mice. (A) HO-1 overexpression was verified in MCP-5 podocytes. (B) Podocytes overexpressing HO-1 were subjected to serum from DN mice, showed significantly reduced cleaved caspase 3 expression, and co-treatment of HO-1 overexpression with ATF4 siRNA increased cleaved caspase-3 expression. (C) Densitometric analysis of protein expression from Figure 5(B). (D) Immunofluorescence analysis showed increase in autophagy LC3 protein expression by HO-1 overexpression, which was significantly reduced by ATF4 siRNA co-treatment; the scale indicates 10 μm. (E) Quantification of apoptosis rates by flow cytometry supported our western analysis of cleaved caspase-3. (F) Apoptosis was evaluated by flow cytometry. NC siRNA: control siRNA transfected for 48 h; ATF4 siRNA: siRNA-ATF4 transfected for 48 h. Vector: Empty plasmid transfected for 48 h. HO-1 OE: HO-1 overexpression plasmid transfected for 48 h. (**p < 0.01, *p < 0.05).
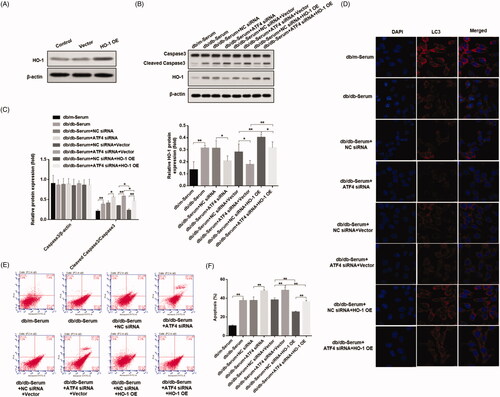
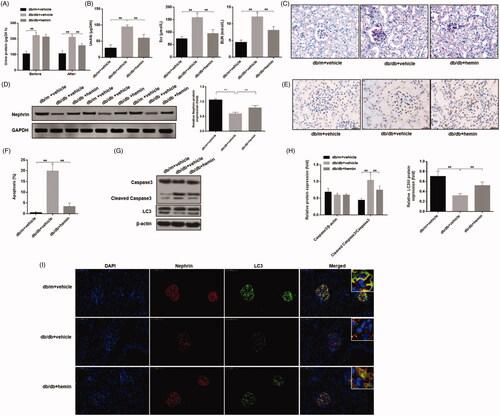
Figure 6. Effects of HO-1 agonist hemin treatment on clinical indications of DN-induced autophagy and apoptosis in podocytes. (A) Evaluation of urinary total protein and urinary albumin showed increased content in DN mice compared to healthy controls, while hemin treatment significantly reduced proteinuria and albuminuria in DN mice. (B) Serum creatinine and urea levels were also significantly reduced by hemin treated DN mice. (C) PAS staining showed glomerular damage in DN mice and it was rescued by hemin treatment. (D) Protein expression analysis revealed that expression of critical protein in renal filtration barrier nephrin was downregulated in DN mice, and hemin treatment significantly increased the neprhin expression and densitometric analysis of protein expression. (E) TUNEL staining showed that hemin treatment significantly reduced apoptotic cells in DN mice. (F) Quantification of apoptotic cells. (G) Protein expression by Western blot. (H) Densitometric analysis of protein expression. (I)Expression and distribution of nephrin and LC3 protein were evaluated by immunofluorescence; the scale indicates 50 μm. (**p < 0.01, *p < 0.05).