Figures & data
Figure 1. Flow chart of study design.
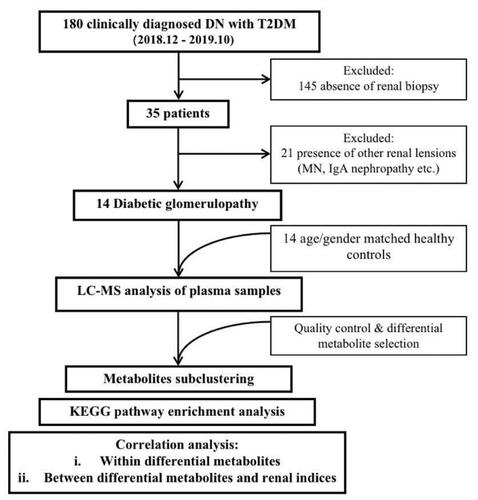
Table 1. Participants demographic and clinical features.
Figure 2. Analysis and validation of serum metabolites disparity between DGs and HCs. (A) PCA scores plots; (B) PLS-DA scores plot; (C) OPLSA-DA scores plot; (D) Scatter plots of the statistical validations obtained by 200’s permutation tests.
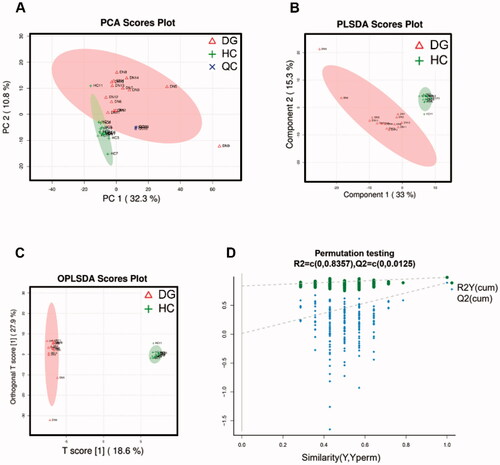
Figure 3. HCA for important differential metabolites between DGs and HCs. (A) Hierarchical clustering and heatmap of all 182 metabolites that were identified to be significantly different (p ≤ 0.05) in concentration between DGs (n = 14) and HCs (n = 14). (B) Trend line charts of 4 subclusters presenting average expression level of the important differential metabolites they contained.
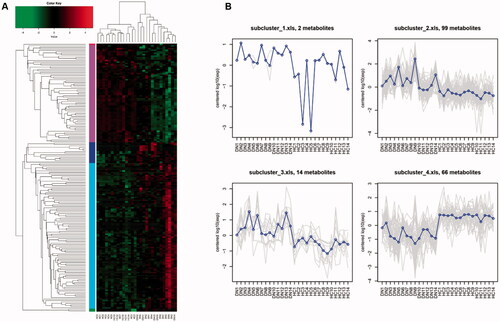
Figure 4. Advanced metabolic pathways analysis. (A) The top 16 metabolic pathways ranked by the number of important differential metabolites they contained. (B) The KEGG enrichment analysis of all 11 significantly enriched metabolic pathways. (C) The bubble chart of KEGG pathway topology indicating the tryptophan metabolism are influenced most notably by its important differential metabolites.
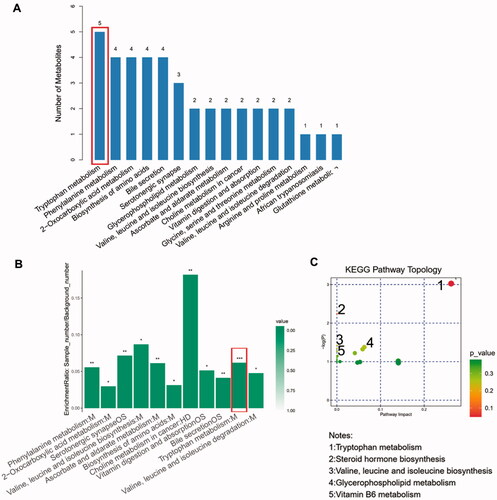
Figure 5. The boxplots showing the comparison of the relative expression level of four important differential metabolites of tryptophan metabolism and other four selected metabolites between DGs and HCs. (A) L-Tryptophan. (B) Serotonin. (C) Indole-3-acetamide. (D) 5-Hydroxyindoleacetic acid. (E) Glycerophopshocholine. (F) 3-(3-hydroxyphenyl)propionic acid (3-OHPPA). (G) 2-Isopropylmalic acid. (H) 1-methyluric acid. *p < 0.05, **p < 0.01 and ***p < 0.001 vs. HCs. M: metabolism; HD: human diseases; OS: organismal system.
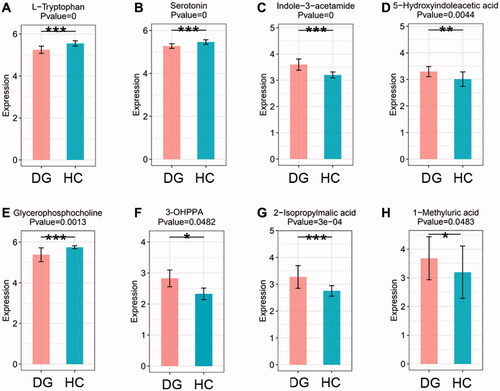
Figure 6. The heatmap of the correlation analysis between 24 selected important differential metabolites (containing 4 important differential metabolites of tryptophan metabolism) and 6 crucial renal indices (i.e., blood glucose, urea, Ghb, T/Cr and 24 h urine protein). Ghb: glycosylated hemoglobin; T/Cr: urine total protein and creatinine ratio.
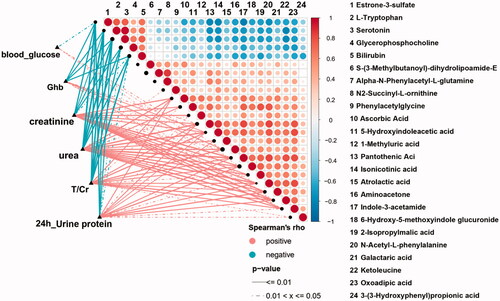
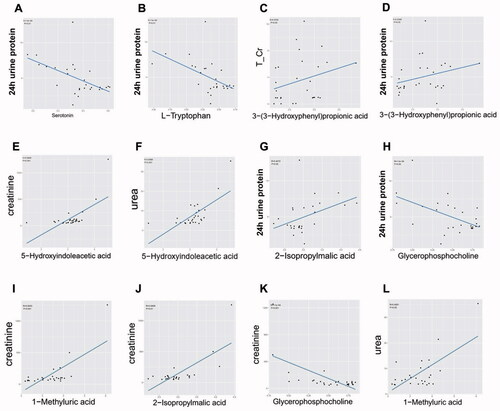
Figure 7. A-L. The linear regression plots of the correlation relationship between 7 selected important differential metabolites (containing 3 important differential metabolites of tryptophan metabolism) and 4 crucial renal indices (i.e., 24 h urine protein, T/Cr: serum urea and creatinine). T/Cr: urine total protein and creatinine ratio.