Figures & data
Table 1. Demographic and perioperative factors of CSA-AKI (n = 2449).
Table 2. Distribution of peripheral blood cell counts and NLPR in AKI and non-AKI patients (n = 2449).
Figure 1. Dose-response relationship of CSA-AKI and peripheral blood cell counts and NLPR.
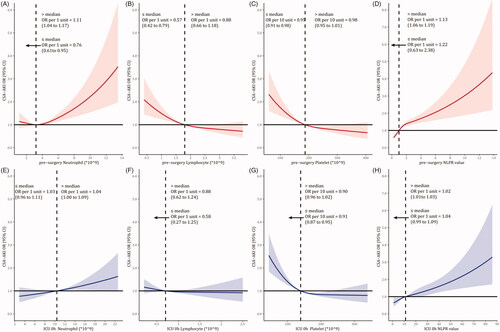
Table 3. Perioperative NLPR levels and their association with CSA-AKI (n = 2449).
Table 4. Antibiotic treatment and the risk of CSA-AKI in high NLPR groups (n = 365).
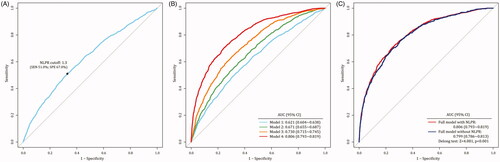
Figure 2. Prediction model of CSA-AKI through the generalized estimating equation (GEE). (3A: the optimal NLPR cutoff was set at 1.3; 3B: model 1 only enrolled the NLPR values in two-time points, model2 was model 1 plus demographic factors; model 3 was model 2 plus preoperative factors, model 4 was model 3 plus intra-/postoperative factor; 3C: comparison between the model with and without NLPR).