
Figures & data
Figure 1. THC improved the survival rate of septic mice and retarded the bacterial growth in blood and kidney after CLP surgery. (A) Molecular formula of THC. (B) Survival curves. (C) Bacterial counts in blood. (D) Bacterial counts in kidney. Data were presented as the mean ± SEM (n = 6 in each group). ##p< .01 vs. the Sham group, **p< .01 vs. the CLP group.
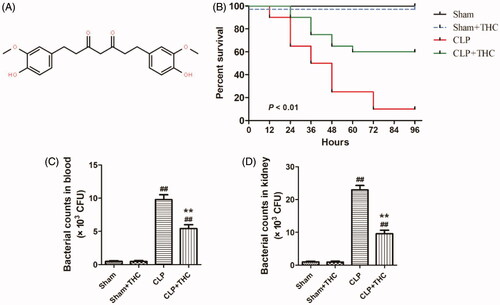
Table 1. Catalog numbers for the main antibodies and kits.
Table 2. Sequences of primers used for quantitative RT-PCR assays.
Figure 2. THC improved the kidney function and ameliorated renal histological damage in septic mice. (A) The serum level of BUN. (B) The serum level of Cr. (C) The urine level of KIM-1. (D) The urine level of UAlb/Cr. (E) Representative images of HE staining of renal histological changes (black arrow: glomerulus degeneration and necrosis, white arrow: renal tubules edema) (magnification ×400, scale bar = 50 μm). (F) Histological score. Data were presented as the mean ± SEM (n = 6 in each group). ##p< .01 vs. the Sham group, **p< .01 vs. the CLP group.
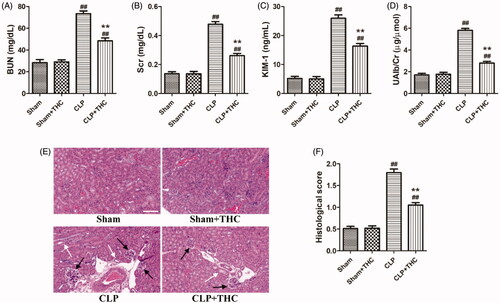
Figure 3. THC promoted the expression of SIRT1 in renal tissues in septic mice. (A) SIRT1 expression. (B) Relative SIRT1 activity. Data were presented as the mean ± SEM (n = 6 in each group). ##p< .01 vs. the Sham group, **p< .01 vs. the CLP group.
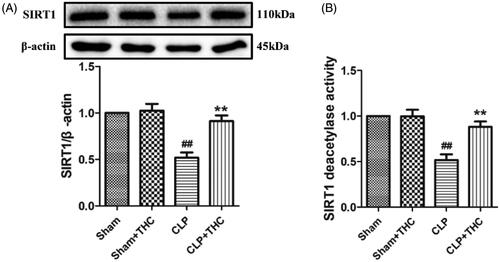
Figure 4. EX527 blocked THC induced attenuation of renal damage and kidney dysfunction in septic mice. (A) The serum level of BUN. (B) The serum level of Cr. (C) The urine level of KIM-1. (D) The urine level of UAlb/Cr. (E) Representative images of HE staining of renal histological changes (black arrow: glomerulus degeneration and necrosis, white arrow: renal tubules edema) (magnification ×400, scale bar = 50 μm). (F) Histological score. Data were presented as the mean ± SEM (n = 6 in each group). *,**p< .05/.01 vs. the CLP group, ^^p< .01 vs. the CLP + THC group, &&p< .01 vs. the CLP + THC + EX527 group.
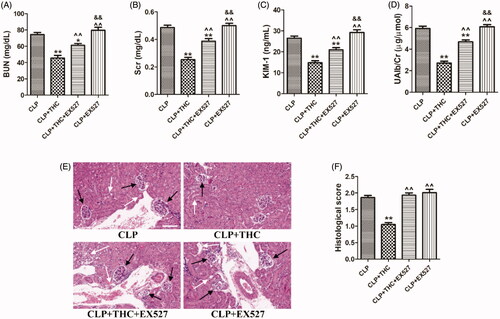
Figure 5. EX527 blunted THC induced amelioration of inflammatory response in renal tissues in septic mice. (A) Representative blots. (B) IL-1β expression. (C) IL-6 expression. (D) TNF-α expression. (E) Relative IL-1β mRNA level. (F) Relative IL-6 mRNA level. (G) Relative TNF-α mRNA level. Data were presented as the mean ± SEM (n = 6 in each group). **p< .01 vs. the CLP group, ^^p< .01 vs. the CLP + THC group, &&p< .01 vs. the CLP + THC + EX527 group.
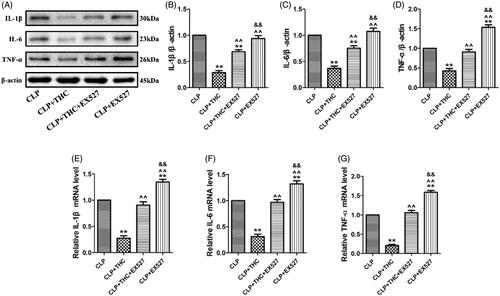
Figure 6. EX527 counteracted THC induced inhibition of oxidative stress in renal tissues in septic mice. (A) Renal MDA content. (B) Renal SOD activity. (C) Renal GSH activity. (D) Renal GPx activity. (E) Renal CAT activity. (F) Renal ROS production. Data were presented as the mean ± SEM (n = 6 in each group). *,**p< .05/.01 vs. the CLP group, ^^p< .01 vs. the CLP + THC group, &&p< .01 vs. the CLP + THC + EX527 group.
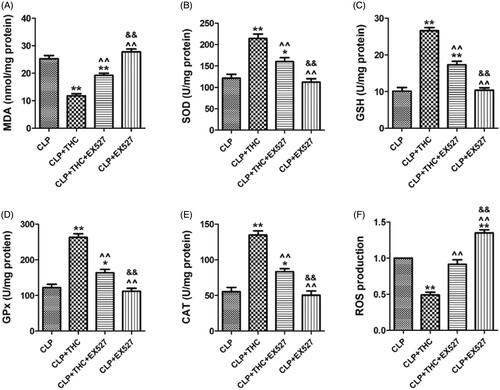
Figure 7. EX527 abolished THC induced prevention of cell apoptosis in renal tissue in septic mice. (A) Representative images of TUNEL staining (scale bar = 50 μm). The apoptotic cells were detected by TUNEL (green) and the nuclei were detected by DAPI (blue). (B) Cellular apoptotic index. (C) Relative Bcl2 mRNA level. (D) Relative Bax mRNA level. (E) Cleaved caspase-3 expression. Data were presented as the mean ± SEM (n = 6 in each group). **p< .01 vs. the CLP group, ^^p< .01 vs. the CLP + THC group, and &&p< .01 vs. the CLP + THC + EX527 group.
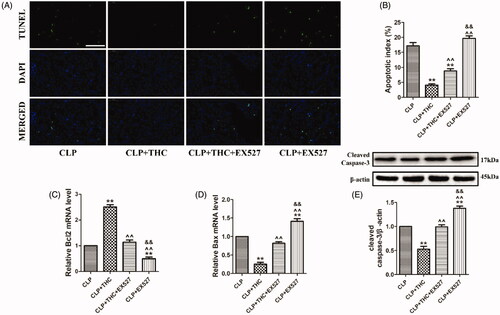
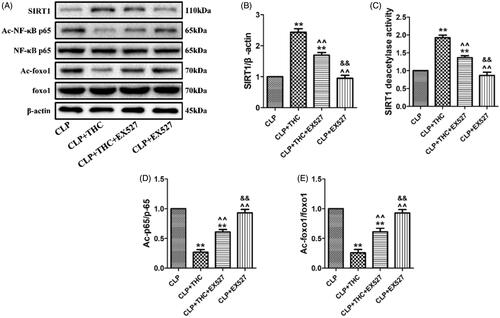
Figure 8. THC could protect renal tissue from sepsis-induced AKI through the activation of SIRT1. (A) Representative blots. (B) SIRT1 expression. (C) Relative SIRT1 activity. (D) Ac-NF-κB expression. (E) Ac-foxo1 expression. Data were presented as the mean ± SEM (n = 6 in each group). **p< .01 vs. the CLP group, ^^p< .01 vs. the CLP + THC group, &&p< .01 vs. the CLP + THC + EX527 group.
Data availability statement
The data used to support the findings of this study are available from the corresponding author upon request.