
Figures & data
Table 1. Description of the formulas used.
Table 2. Demographic, clinical characteristics, and laboratory findings of critically ill and moderate patients.
Figure 1. Comparison of sCr and CysC between critically ill patients and moderate patients. (a) The SCr of critically ill patients has an equivalent median with moderate patients but distributed more dispersedly; (b) The median of CysC was significantly higher in critically ill patients than in moderate patients.
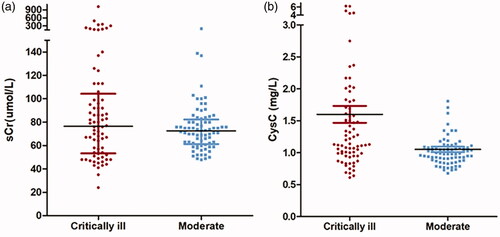
Figure 2. Proportion of different definition of “renal dysfunction” including elevated sCr, elevated CysC, eGFRcr<60, eGFRcysc<60 in critically ill patients and moderate patients. In critically ill group, eGFRcysc less than 60 mL/min/1.73 m2 presented in 50 % patients and eGFRcr less than 60 mL/min/1.73 m2 presented in 25 % (p = 0.001). This divergence was not obvious in the moderate group (14.5 % vs 6.6 %, χ2 = 2.515, p = 0.113). The proportion of elevated sCr and elevated CysC was 25 % and 31.6 % (p = 0.368)in critically ill patients. In moderate group, the proportion of elevated sCr was equal to elevated CysC (20 %).
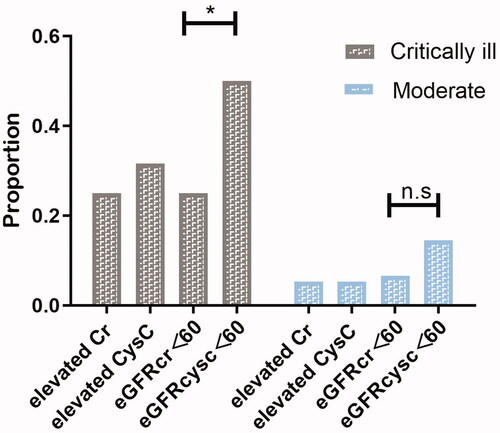
Table 3. Demographic, clinical characteristics, and laboratory findings of nonsurvivors and survivors in critically ill patients.
Table 4. Renal function estimation using sCr and CysC showed differences in the same 76 critical ill patients.
Table 5. Differences of IL-6, TNF-α and APACHEII among three subgroups graded by the gap between eGFRcr and eGFRcysc.
Figure 3. The Kaplan–Meier survival curves for critically ill patients divided by reduced eGFRcr (a), reduced eGFRcysc (b), elevated sCr(c) and elevated CysC (d). Reduced eGFRcr (<60 mL/min/1.73 m2) rather than reduced eGFRcysc was associated with death after ICU admission in critically ill patients with COVID-19. Both elevated sCr and elevated CysC were associated with death after ICU admission in critically ill patients with COVID-19.
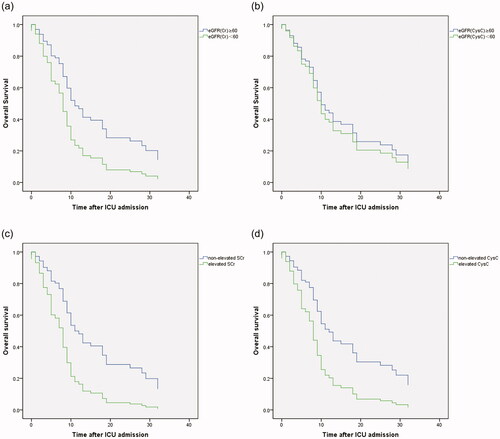
Figure 4. Patients with bigger divergence between eGFRcr and eGFRcysc had higher IL6, TNFα levels and APACHEII, SOFA scores. (Critically ill patients were grouped according to the difference ratio (△eGFRcr-cysc%) defined as △eGFRcr-cysc/mean of eGFRcr and eGFRcysc; Groups 1, 2, and 3 represented patients with △eGFRcr-cysc% 0–25%, 25%–45% and >45%, respectively).
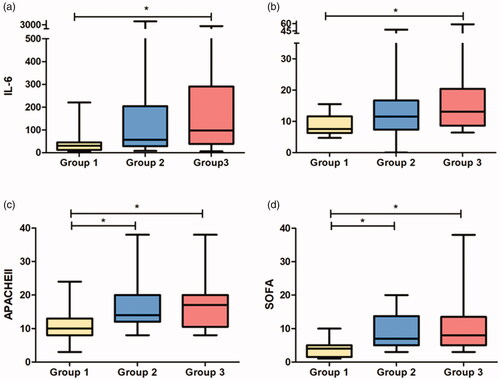
Table 6. Different multivariate Cox proportional hazards models for risk factors of in-ICU death.