
Figures & data
Figure 1. The flowchart of the enrolled patients.
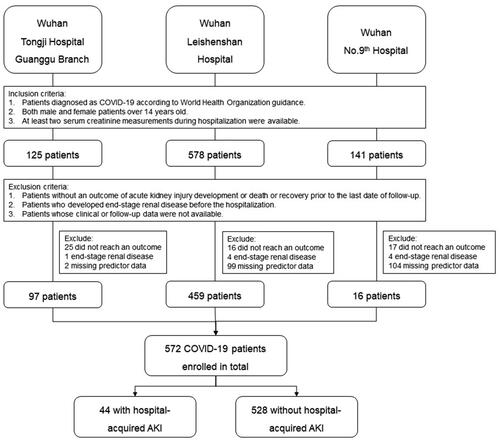
Table 1. Demographic and outcome of patients from COVID-19 validation cohort and UCSD development cohort.
Figure 2. Validation of UCSD-Mayo Model in the COVID-19 cohort. (a) Area under curve of UCSD-Mayo risk score for prediction of AKI in COVID-19 validation cohort. (b) Kaplan–Meier curve with AKI-free survival of patients (n = 572) according to their risk group. (c) Calibration curve of UCSD-Mayo risk score for prediction of acute kidney injury in COVID-19 validation cohort.
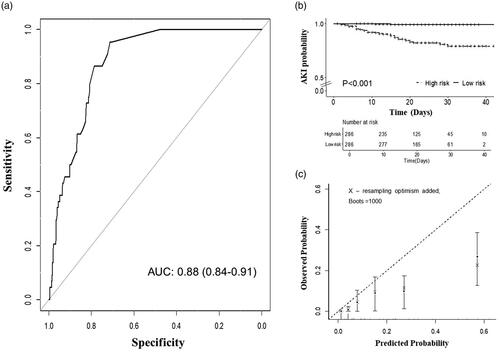
Table 2. Cox regression analysis of predictors from the UCSD-Mayo model (n = 572 patients).
Figure 3. Subgroup analysis of UCSD-Mayo model in COVID-19 cohort.
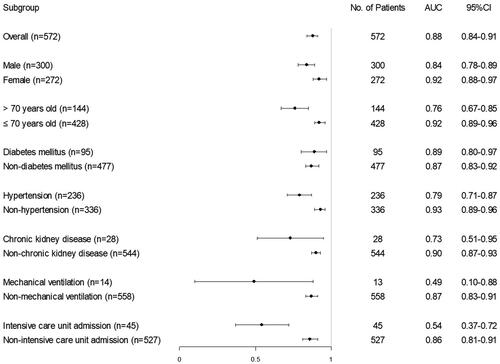
Table 3. Clinical features of patients with ICU and non-ICU admission.
Data availability statement
The datasets used and/or analyzed during the current study are available from the corresponding author on reasonable request.