
Figures & data
Figure 1. Screening process for enrolled patients.
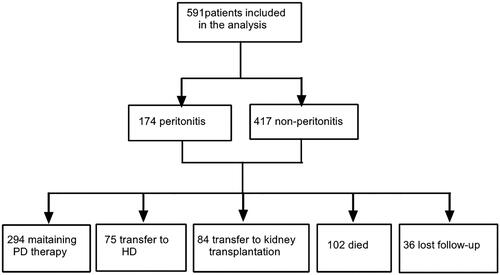
Table 1. Reasons for withdrawal from PD therapy.
Table 2. Outcome of the different organisms infection for the first episode of peritonitis (n = 174).
Table 3. Baseline characteristics of patients.
Table 4. Baseline characteristics of patients in different transport types.
Figure 2. Kaplan-Meier curves of comparative technique survival by peritoneal dialysis patients of peritonitis VS nonperitonitis.
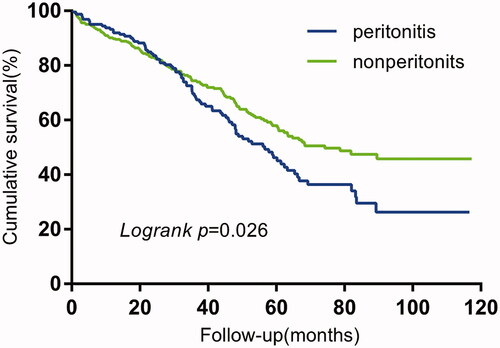
Figure 3. Kaplan-Meier curves of comparative overall survival by peritoneal dialysis patients of peritonitis VS nonperitonitis.
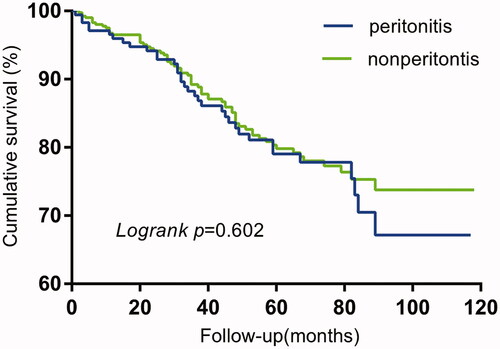
Table 5. Risk factors of first peritonitis episode.
Table 6. Risk factors of technique failure.
Table 7. Risk factors of overall mortality.