
Figures & data
Figure 1. Flow diagram for inclusion of patients.
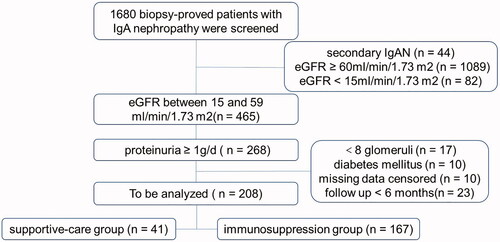
Table 1. Comparison of baseline clinical features between different Therapeutic Schedule.
Figure 2. Kaplan–Meier plots of renal survival curves for primary outcome. (a) Renal survival according to patients with immune-suppression group (IS) versus supportive care (SC) group. (b) Renal survival according to patients with IS and (or) corticosteroids (CS) versus CS group.
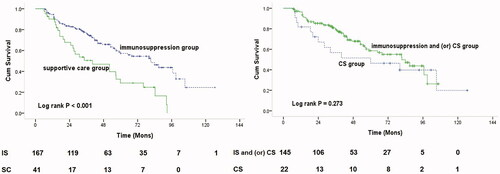
Table 2. End points on the basis of the available patients at the end of the study phase.
Table 3. Effects of immunosuppressive therapy on kidney survival IgA nephropathy patients with decreased eGFR.
Table 4. Prespecified subgroup analysis of the primary composite outcome.
Table 5. Adverse events during the follow-up period.