
Figures & data
Figure 1. Differential expression of lncRNAs in ARAS patients and control individuals. (A) The scatter plots showed LncRNA expression in test samples versus normal samples. X-axis depicted data values of control samples; Y-axis depicted data values of test samples. Dots were located above the upper green line and below the under green line represent fold change ≥1.5, ‘Test’ indicates ARAS samples; ‘Normal,’ control samples. (B) Heat map of lncRNA expression from microarray analysis of combined renal artery tissue samples of patients with ARAS and control subjects (T, renal atherosclerosis tissue; C, normal renal artery tissue). Each row represented one lncRNA and each column represents a sample. The color scale shown at the top illustrated the relative expression level of a lncRNA; red represents high expression and green represented low expression. (C) The volcano plots showed thousands of lncRNAs were significantly different by using lncRNA expression thresholds of more than 1.5-fold change with p<.05. The red point in the plot represented the deferentially expressed Coding genes with statistical significance.
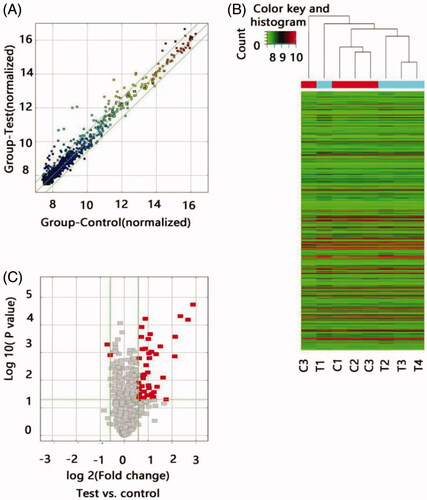
Table 1. Characteristics of a training group population.
Figure 2. Expression levels of lncRNAs RP11-387H17.6, BC080653, RP1-32B1.4, RP5-1068H6.3, GHRLOS, and XLOC_009769 were assessed by quantitative polymerase chain reaction (qPCR) using GAPDH as a reference gene for normalization among patients with ARAS (n = 18), non-ARAS (n = 18), and HV(n = 18). (A–F) Expression levels of lncRNAs: (A) RP11-387H17.6, (B) BC080653, (C) RP1-32B1.4, (D) RP5-1068H6.32, (E) GHRLOS, and (F) XLOC_009769. ARAS: atherosclerotic renal artery stenosis; HV: healthy volunteers.
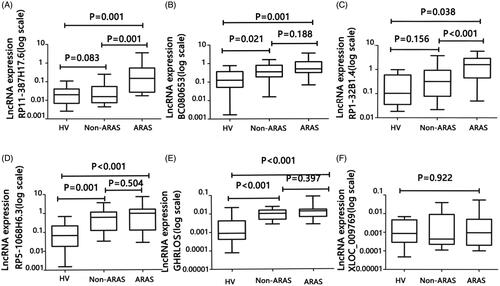
Figure 3. Receiver operating characteristic (ROC) curve analyses of LncRNAs RP11-387H17.6, BC080653, RP1-32B1.4, RP5-1068H6.3, GHRLOS, and XLOC_009769 for diagnosis of ARAS among patients with ARAS (n = 18), non-ARAS (n = 18), and HV (n = 18). AUC: area under the curve, ARAS: atherosclerotic renal artery stenosis. (A–F) Expression levels of lncRNAs: (A) RP11-387H17.6, (B) BC080653, (C) RP1-32B1.4, (D) RP5-1068H6.32, (E) GHRLOS, and (F) XLOC_009769. ARAS: atherosclerotic renal artery stenosis; HV: healthy volunteers.
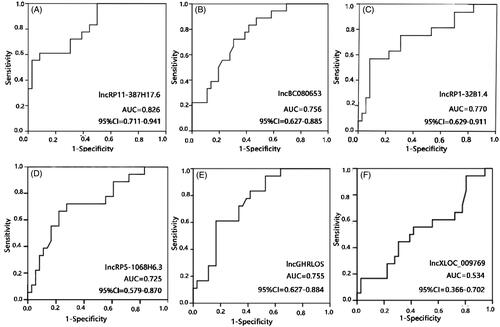
Figure 4. Expression levels of lncRP11-387H17.6 and ROC curve analyses of lncRP11-387H17.6 alone and lncRP11-387H17.6 combined with risk factors for the diagnosis of ARAS among patients with ARAS (n = 99), non-ARAS (n = 45), and HV (n = 50). (A) Expression levels of lncRNAs RP11-387H17.6 among patients with ARAS (n = 99), non-ARAS (n = 49), and HV (n = 50). GAPDH was used as the normalization control. (B) ROC curves showing the diagnostic performance of lncRP11-387H17.6 alone and lncRP11-387H17.6 combined with risk factors. ARAS: atherosclerotic renal artery stenosis; HV: healthy volunteers.
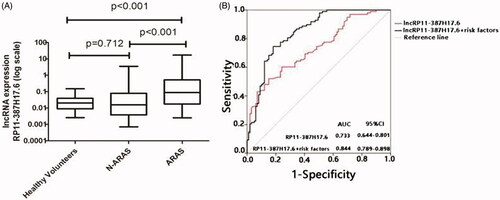
Table 2. Characteristics of a testing group population.
Table 3. Univariate analysis for lncRP11-387H17.6 in patients with ARAS.
Table 4. Multivariate analysis for lncRP11-387H17.6 in patients with ARAS.