
Figures & data
Figure 1. Participant selection flow chart. eGFR, estimated glomerular filtration rate; RRT, renal replacement therapy.
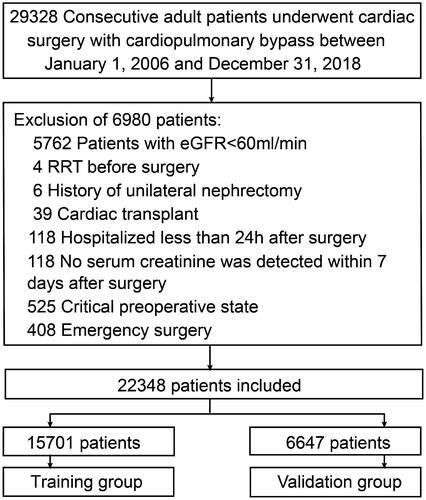
Table 1. Baseline characteristics of training and validation groups.
Figure 2. Predictor selection by the least absolute shrinkage and selection operator (LASSO) regression method. (A) The penalty tuning parameter (λ) in the LASSO model was conducted by ten-fold cross-validation with minimum criteria. Log(λ) was drawn vs. AUC. Dotted vertical lines were plotted at ideal values utilizing minimum criteria and one standard error of minimum criteria (1-SE criteria). Log(λ) of -4.528 and λ value of 0.0108 were selected. (B) Coefficient profile plot of the 35 predictors. Dotted vertical lines were plotted at ideal values utilizing the same criteria as in (A). Nine predictors with non-zero coefficients were selected.
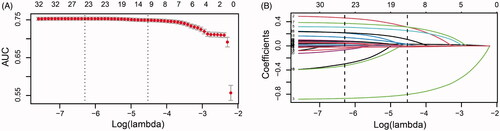
Figure 3. Nomogram for risk assessment of AKI after cardiac surgery in individuals who had normal kidney function. LVEF, left ventricular ejection fraction; NSAID, non-steroidal anti-inflammatory drugs; RASIs, renin-angiotensin system inhibitors.
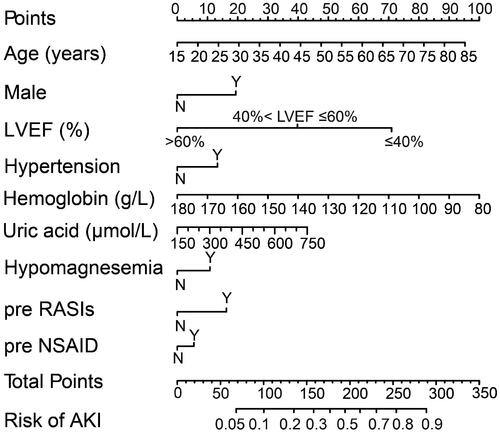
Table 2. Multivariate logistic regression analysis of variables for predicting acute kidney injury after cardiac surgery.
Figure 4. Model receiver operating characteristic and calibration curves. (A) AUC for postoperative AKI was 0.751 (95% CI, 0.743–0.760) in training group. (B) Calibration curve for new model in training group. (C) AUC for postoperative AKI was 0.740 (95% CI, 0.726–0.753) in validation group. (D) Calibration curve for new model in validation group. Calibration plots illustrate the relationship between the predicted AKI risk according to the models and actual occurrence of AKI in the validation data. Plot along the 45° line represents model calibration in which predicted probabilities are identical to actual outcomes. Dotted line has a close fit to solid line, indicating a better predictive model.
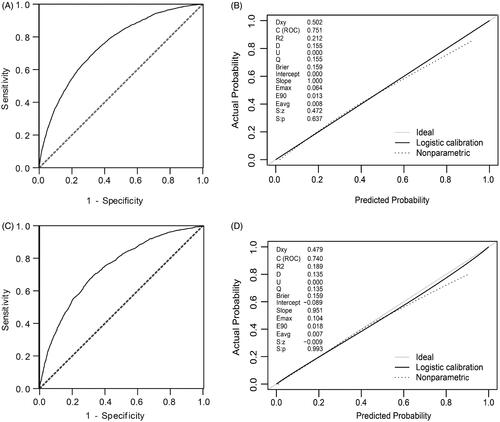
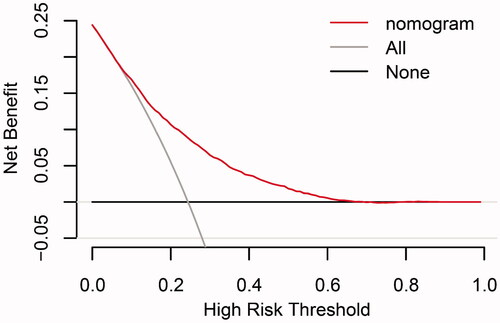
Figure 5. Decision curve analyses for prediction model. X- and Y‐axes show threshold probability and net benefit, respectively. Dashed and solid black lines represent the hypothesis that no patients and all patients had AKI, respectively. Net benefit was computed by subtracting the proportion of false positives from the proportion of true positives in all patients, weighting relative harm driven by the false positive. Threshold probability was estimated as the expected benefit of avoiding treatment equivalent to the expected treatment benefit. Net new model benefits are represented for each decision threshold. Using the new model to predict the risk of postoperative AKI generated a net benefit across most of the range of prediction thresholds.
Supplemental Material
Download PDF (22.3 KB)Supplemental Material
Download PDF (105 KB)Data availability statement
The datasets used and analyzed during the current study are available from the corresponding authors on reasonable request.